User-Friendly GUI for DAQ: Streamlining Data Access and Compatibility Across Accelerators
This innovative GUI for Data Acquisition (DAQ) is designed to address challenges in data retrieval and compatibility with past, present, and future DAQ versions. It efficiently handles large datasets, allowing users to quickly search for specific data points such as temperature stability or average bunch charge. The tool facilitates fast access to Facility Status History (FSH) logs and provides pre-defined plots to visualize critical parameters like RF, magnets, and vacuum states. It enhances user experience while ensuring compatibility and ease of use for various accelerators.

User-Friendly GUI for DAQ: Streamlining Data Access and Compatibility Across Accelerators
E N D
Presentation Transcript
Challenges to face • compatible with past, present and future versions of DAQ • compatible with TTF1, PITZ, TTF2, … • help to find data • be user friendly • handle large amount of DAQ
Search for data example: • the accelerator was on…sometime last week • check temperature stability during 800 μs RF • or get the average bunch charge • where is the start/end?
FSH: Facility Status History
Logfile for FSH • not on tape! fast access required • specific to each accelerator • DAQ should create it • we have to create it “manually” for old data • advantage: solves compatibility problem
Archive filter G.Asova, K.Abrahamyan • access data stored • compare with a threshold value (filter) • save data onto a file • use GUI for selecting the filter
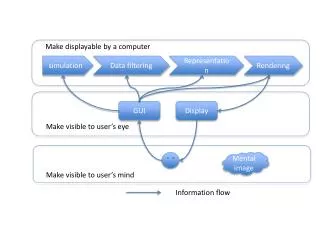
Display P.Castro history plot
history plot histogram correlation plot + fits
Shift summary plots I.Bohnet, K.Abrahamyan • RF, magnets, vacuum, temperatures, interlocks, set-points, ... • “pre-defined” plots: scales, time period, variables, etc. are defined