Download
1 / 22
220 likes | 346 Views
Health Insurance Coverage and Access to Care for Communities of Color Presentation for the Health Disparities Council. Kate Nordahl Assistant Commissioner Division of Health Care Finance and Policy . Presentation Overview. Who are the uninsured? Uninsurance rates by race/ethnicity and age

E N D
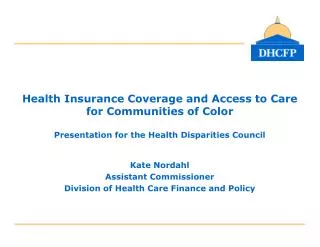
Health Insurance Coverage and Access to Care for Communities of ColorPresentation for the Health Disparities Council Kate Nordahl Assistant Commissioner Division of Health Care Finance and Policy
Presentation Overview • Who are the uninsured? • Uninsurance rates by race/ethnicity and age • Type of insurance coverage by race/ethnicity and age • Access to and use of care • Usual source of care • Doctors visit in past 12 months • ER visit in past 12 months • Barriers to care due to cost
Uninsurance Uninsurance Ratefor All Massachusetts Residents Uninsurance was low among Massachusetts residents, with less than 3% (167,300 people) uninsured at the time of the survey (summer 2008). Source: Urban Institute tabulations on the 2008 Massachusetts HIS Massachusetts Division of Health Care Finance and Policy
Who are the Uninsured? • More likely to be: • Male (57% of the uninsured are male vs. 48.2% in general population) • Young adult - 19 to 25 years of age (32.1% vs. 15.2%) • Hispanic (18.8% vs. 6.8%) • Non-citizen (14.5% vs. 4.6%) • Low-income • <150% FPL (45.1% vs. 20.2%) • 151-299% FPL (33.9% vs. 18.7%) • With less formal education • Less than high school (12.0% vs. 3.9%) • High school graduate or GED (55.6% vs. 40.0%) • Non-working or working only part-time • If work, work for a small sized firm (<51 employees) and for a firm that doesn’t offer employer-sponsored insurance (ESI)
Uninsurance Uninsurance Rates by Race/Ethnicity, All Ages Hispanic residents were most likely to go without coverage in Massachusetts, with an uninsurance rate more than twice as high as other non-Hispanic groups (7.2% versus less than 3%). Source: Urban Institute tabulations on the 2008 Massachusetts HIS Massachusetts Division of Health Care Finance and Policy
Uninsurance Uninsurance Rates of Non-Elderly Adults (ages 19-64) by Race/Ethnicity Uninsurance was highest among non-elderly Hispanic adults in Massachusetts, with an uninsurance rate roughly three times that of other, non-Hispanic groups. Source: Urban Institute tabulations on the 2008 Massachusetts HIS Massachusetts Division of Health Care Finance and Policy
Uninsurance Uninsurance Rates of Children (<18) by Race/Ethnicity Uninsurance was highest among Hispanic children in Massachusetts, with 2.6% uninsured. Note: there was not large enough sample size to report Black, non-Hispanic and Asian, non-Hispanic separately Source: Urban Institute tabulations on the 2008 Massachusetts HIS Massachusetts Division of Health Care Finance and Policy
Type of Coverage Type of Health Insurance Coverage* by Race/Ethnicity, All Ages Employer-sponsored insurance was more common among white, non-Hispanic residents of Massachusetts (71%) than among other race, non-Hispanic or Hispanic residents (63% and 45%, respectively). *Insurance coverage is based on the hierarchy: Medicare, employer-sponsored insurance, public or other coverage. Public and other coverage are combined because of the survey respondents’ difficulties in reporting type of coverage. For lower-income residents, public or other coverage is mostly MassHealth or Commonwealth Care, while for higher-income residents it is non-group coverage and, to a lesser extent, Commonwealth Choice. Source: Urban Institute tabulations on the 2008 Massachusetts HIS Massachusetts Division of Health Care Finance and Policy
Type of Coverage Type of Health Insurance Coverage* of Non-Elderly Adults by Race/Ethnicity Employer-sponsored coverage was most common among white, non-Hispanic adults (83%), compared to other race, non-Hispanic adults (73%) and Hispanic adults (54%). *Insurance coverage is based on the hierarchy: Medicare, employer-sponsored insurance, public or other coverage. Public and other coverage are combined because of the survey respondents’ difficulties in reporting type of coverage. For lower-income residents, public or other coverage is mostly MassHealth or Commonwealth Care, while for higher-income residents it is non-group coverage and, to a lesser extent, Commonwealth Choice. Source: Urban Institute tabulations on the 2008 Massachusetts HIS Massachusetts Division of Health Care Finance and Policy
Type of Coverage Type of Health Insurance Coverage* of Children by Race/Ethnicity Employer-sponsored coverage was most common among non-Hispanic, white children (79%), compared to other race, non-Hispanic children (56%) and Hispanic children (42%). *Insurance coverage is based on the hierarchy: Medicare, employer-sponsored insurance, public or other coverage. Public and other coverage are combined because of the survey respondents’ difficulties in reporting type of coverage. For lower-income residents, public or other coverage is mostly MassHealth or Commonwealth Care, while for higher-income residents it is non-group coverage and, to a lesser extent, Commonwealth Choice. Source: Urban Institute tabulations on the 2008 Massachusetts HIS Massachusetts Division of Health Care Finance and Policy
Non-Elderly Adults Non-Elderly Adults with a Usual Source of Care by Race/Ethnicity Other, non-Hispanic adults were less likely to have a usual source of care than white adults and adults reporting other race/ethnicities. Source: 2008 Massachusetts Health Insurance Survey Massachusetts Division of Health Care Finance and Policy
Non-Elderly Adults Non-Elderly Adults with a Usual Source of Care by Insurance Status Compared with the insured, uninsured non-elderly adults were much less likely to have a usual source of care (42% versus 91%). Source: 2008 Massachusetts Health Insurance Survey Massachusetts Division of Health Care Finance and Policy
Children Children with a Usual Source of Care by Race/Ethnicity Hispanic children were least likely to have a usual source of care, compared to other race/ethnicity groups. Source: 2008 Massachusetts Health Insurance Survey Massachusetts Division of Health Care Finance and Policy
Non-Elderly Adults Non-Elderly Adults with a Doctor Visit in Past 12 Months by Race/Ethnicity Among non-elderly adults, those who reported other, non-Hispanic race/ethni-cities were less likely than white, non-Hispanic or Hispanic adults to have had any doctor visits or a preventive care visit. Source: 2008 Massachusetts Health Insurance Survey Massachusetts Division of Health Care Finance and Policy
Children Children with a Doctor Visit in Past 12 Months by Race/Ethnicity Hispanic and other, non-Hispanic children were less likely than white, non-Hispanic children to have had any doctor visit or a preventive care visit in the past 12 months. Source: 2008 Massachusetts Health Insurance Survey Massachusetts Division of Health Care Finance and Policy
Non-Elderly Adults Non-Elderly Adults with an ER Visit in the Past 12 Months by Race/Ethnicity Among non-elderly adults, Hispanics were much more likely to have had an ER visit overall and an ER visit for a non-emergency than other race/ethnicity groups. *A non-emergency ER visit is one that the respondent says could have been treated by a regular doctor if one had been available. Source: 2008 Massachusetts Health Insurance Survey Massachusetts Division of Health Care Finance and Policy
Children Children with an ER Visit in the Past 12 Months by Race/Ethnicity Hispanic children were much more likely than non-Hispanic children to have had an emergency or non-emergency ER visit. *A non-emergency ER visit is one that the respondent says could have been treated by a regular doctor if one had been available. Source: 2008 Massachusetts Health Insurance Survey Massachusetts Division of Health Care Finance and Policy
Non-Elderly Adults Non-Elderly Adults Not Getting Needed Care Due to Cost in Past 12 Months by Race/Ethnicity Among non-elderly adults, one-quarter of white, non-Hispanic adults skipped needed health care due to cost, compared with 29% of other, non-Hispanic adults and 35% of Hispanic adults. Source: 2008 Massachusetts Health Insurance Survey Massachusetts Division of Health Care Finance and Policy
Children Children Not Getting Needed Care Due to Cost in Past 12 Months by Race/Ethnicity Unmet need for health care due to cost was highest for Hispanic children, at 22%. Source: 2008 Massachusetts Health Insurance Survey Massachusetts Division of Health Care Finance and Policy
Non-Elderly Adults Non-Elderly Adults in Families with Problems Paying Medical Bills in Past 12 Months by Race/Ethnicity Among non-elderly adults, black, non-Hispanics were more likely to report problems paying medical bills than were white, non-Hispanic adults. Source: 2008 Massachusetts Health Insurance Survey Massachusetts Division of Health Care Finance and Policy
Children Children in Families with Problems Paying Medical Bills in Past 12 Months by Race/Ethnicity Other, non-Hispanic and Hispanic children were most likely to live in families that had trouble paying medical bills (22%). Source: 2008 Massachusetts Health Insurance Survey Massachusetts Division of Health Care Finance and Policy
Summary • While Massachusetts has made great strides to reduce uninsurance and improve access to care the Hispanic population is more likely to: • be uninsured • use the emergency department in the past 12 months • have sought care in the ER for a non-emergency • have not sought needed care due to cost • The Hispanic, non-elderly adult population is less likely to have a usual source of care • In addition, Black, non-Hispanic non-elderly adults were more likely to: • have not sought needed care due to cost • have problems paying medical bills