Download
1 / 28
280 likes | 424 Views
Comparison of Satellite and Ground Vegetation Indexes to Estimate Erosion in a Mediterranean-climate Watershed. Miguel A. González-Botello Stephen H. Bullock and J. Mario Salazar Ceseña. Terrestrial Ecology Lab Conservation Biology Department

E N D
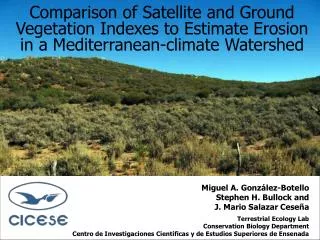
Comparison of Satellite and Ground Vegetation Indexes to Estimate Erosion in a Mediterranean-climate Watershed Miguel A. González-Botello Stephen H. Bullock and J. Mario Salazar Ceseña Terrestrial Ecology Lab Conservation Biology Department Centro de Investigaciones Científicas y de Estudios Superiores de Ensenada
Introduction w Soil erosion is a natural process that reworks the distribution of organic matter, nutrients, and sediments. Accelerated erosion is part of the desertification process: loss of productivity, stored carbon and biodiversity
Introduction Soil erosion across a 5,000 km2 watershed in NW Baja California has been estimated* using the Revised Universal Soil Loss Equation (RUSLE), in GIS. *Smith, S. V. et al. in press. Soil Erosion and its Potential Significance for Carbon Fluxes in a Mountainous Mediterranean-Climate Watershed. Ecological Applications
Introduction In a small area of southern France, DeJong* found a weak, linear relation of C to the Normalized Difference Vegetation Index (NDVI). C = 0.45 - 0.805 (NDVI) (NIR – R) (NIR + R) NDVI= *De Jong, S.M. 1994. Derivation of vegetative variables from a Landsat TM image for modelling soil erosion. Earth Surface Processes and Landforms, Vol. 19, 165-178.
Our objective Our project will evaluate the relation of C (measured in the field with precise methods and large samples distributed over ~3000 km2) to NDVI and to terrain variables (exposure, slope and elevation) and vegetation variables.
Study area Mediterranean-climate part of Mexico. Rainfall of 265 mm Between November and April. Three Terrestrial Prioritized Regions. Chaparral and coastal scrub.
Use of GIS in Site Selection GIS has been an important tool in designing the field work and will be essential to integration of ground and satellite data. The location of the field sites (c. 67) involved the following seven steps:
2. Exclude non-shrub areas Settled, agricultural and woodland or grassland/meadow areas
4. Create Map of Accessible Areas 40 and 250 m From the roads
5. Compare frequency distributions Watershed Accessible area NDVI* NDVI* * May 2005 ASPECT ASPECT
Watershed Accessible area SLOPE SLOPE ELEVATION ELEVATION
6. Select potential field sites Ca. 120 sites. substantially uniform over more than 1 hectare regarding slope, exposure and vegetation (visual or NDVI).
Google Earth Images Digital Globe Site selection involved High resolution images of Digital Globe (Google Earth), INEGI’s Ortophotos, NDVI, and Slope, Aspect & Height. INEGI’s Digital Orthophoto Web Service (WMS) http://antares.inegi.gob.mx/cgi-bin/map4/mapserv_orto?) On ArcGIS 9 Slope derived from Inegi’s DEM On ArcGIS 9 NDVI (May 2005) On ArcGIS 9 Aspect derived from Inegi’s DEM On ArcGIS 9
7. Select among potential sites We selected the sites to best represent the frequencies from the previous slides.
Slope Aspect (North) South North
Height NDVI
Versatility With KML’er 1.2, extensive interaction between Google Earth 3 and ArcGIS 9 was possible.
Field Sampling Method Field measurements were based on 30 m line transects. Drip height, soil surface cover, and types of cover were recorded at 20 random points along the line.
Field Sampling Method To assess aerial cover, we recorded the interception of each plant >20 cm diameter along the entire transect. We also recorded plant species, height, and perpendicular diameter.
Field Sampling Method Also, to better calibrate the erosion model, we collected samples of soil and litter. Terrain variables were recorded to compare with estimates from the digital elevation model.
Satellite Image Processing Landsat data from late April-early May 2007 will be processed for NDVI (and EVI) and variance among years of contrasting rainfall will also be analyzed (2001, 2003, 2005).
Preliminary Results The major part of sites shows a high soil cover (G Subfactor, 0 – 0.1). This reduces substantially the field calculated C Factor.
Preliminary Results De Jong Model tend to overestimate the C factor.
Our preliminary results suggests that the deJong Model is not suitable to assess erosion in Baja California Chaparral and Coastal Scrub.
Next steps Most analyses are pending as field work is recently finished. The acquisition of 2007 Landsat images are in process, the NDVI is not yet available.
Thanks to: 2007 Global Scholarship Program ConservationProgram Centro de Investigaciones Científicas y de Estudios Superiores de Ensenada