Download
1 / 16
190 likes | 408 Views
Numerical and Experimental Modal Characterization of a 3MW Wind Turbine. EWEA 2012. Carlo E. Carcangiu. Copenhagen, 17 th April 2012. Co-authors:. Jon Basurko. Dmitri Tcherniak Shashank Chauhan. Towards larger Wind Turbines. Dynamics is key-important for Up-scaling. Aim.

E N D
Numerical and Experimental Modal Characterization of a 3MW Wind Turbine EWEA 2012 Carlo E. Carcangiu Copenhagen, 17th April 2012 Co-authors: Jon Basurko Dmitri Tcherniak Shashank Chauhan
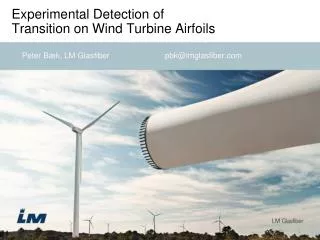
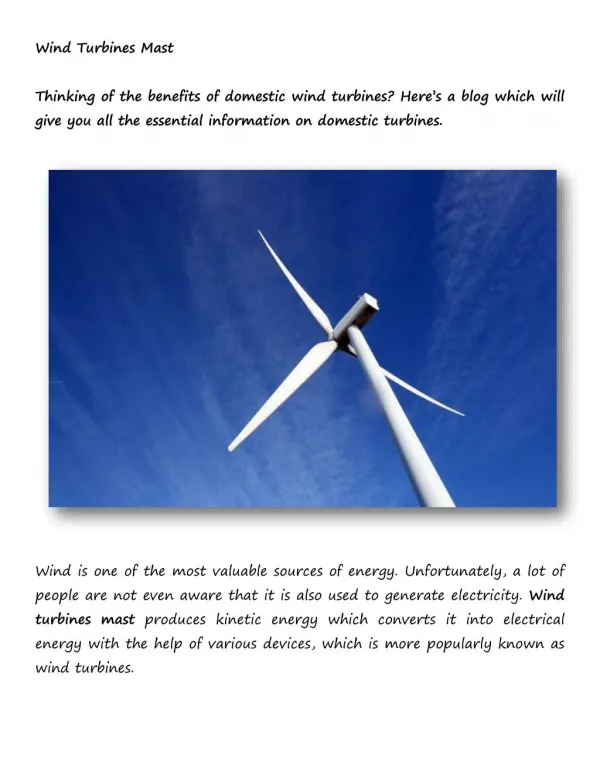
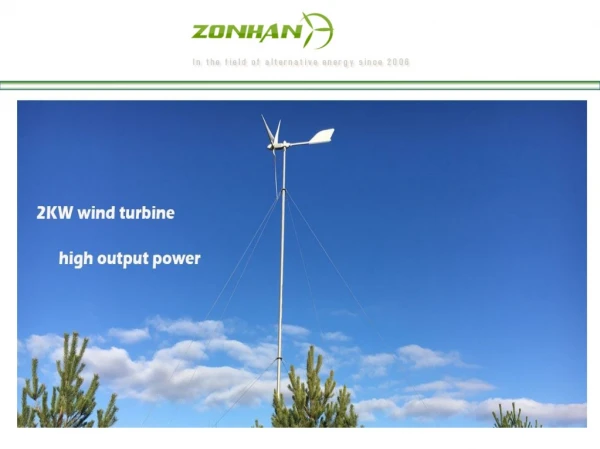
Towards larger Wind Turbines Dynamics is key-important for Up-scaling
Aim • Validate & Improve Numerical Models • Support Design Upgrades Comprehensive Modal Characterization of ECO 100 3MW
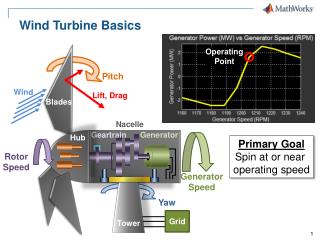
Numerical Models • Finite Element Models • Guide experimental mode extraction • Help understanding physics • Evaluate subsystem modal participation • Analyse influence of model properties (mass, stiffness, etc.) • Optimize sensor location • Aero-Elastic Models • Reflect Wind Turbine Multiphysics • Multi-Body dynamics: improved accuracy Common tools to characterize WT dynamics
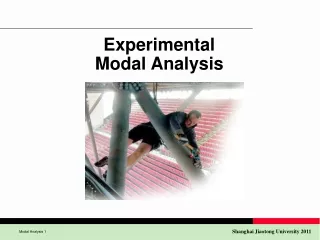
ExperimentsBased OMA Operational Modal Analysis is a System Identification Technique based on Vibration Responses to Unknown Excitation • PROS: • No need for artificial/known excitations WT in normal operation! • WT as One system not a number of interacting subsystems • Real dynamic loads real deflection magnitudes • Correct boundary conditions • CONS: • Time varying nature of WT structure • Harmonic nature of excitation • Considerable aerodynamic damping Specific method developed to overcome limitations OMA main assumptions are strictly valid only in idling conditions Valid Approach to study Wind Turbines Dynamics
Long-Term Measurement Campaign • 4 B&K frontends • 56 B&K accelerometers (DC 1000mV/g) • 10 control signals • 2 tacho probes (LSS) • No sensors on blades Torque-regulated Pitch-regulated 65 Torque-regulated datasets selected for analysis Idling Each point = 15 minute dataset (3850 in total) @ 256 Hz sampling rate Large Amount of Data: need for Automatic Processing
Automatic Data Processing • Software: B&K PULSE OMA Type 7760 • Algorithm: StochasticSubspaceIteration (SSI) Many potential modes: clustering is needed (MAC)
OMA Outputs (1/3): Campbell Diagram Tower & In-plane Modes FA1 FA2 SS1 SS2 I1C Out-of-Plane Modes O1BW O1FW O1C Out-of-Plane modal frequencies are less reliable
OMA Outputs (2/3): Damping Tower modes 20% 18% 16% 14% 12% 10% 8% 6% 4% 2% 0% 20% 18% 16% 14% 12% 10% 8% 6% 4% 2% 0% FA1 SS1 20% 18% 16% 14% 12% 10% 8% 6% 4% 2% 0% 20% 18% 16% 14% 12% 10% 8% 6% 4% 2% 0% FA2 SS2 Confidence Intervals wider for Fore-Aft modes
OMA Outputs (3/3): Damping Rotor Modes 20% 18% 16% 14% 12% 10% 8% 6% 4% 2% 0% 20% 18% 16% 14% 12% 10% 8% 6% 4% 2% 0% 20% 18% 16% 14% 12% 10% 8% 6% 4% 2% 0% I1C I1BW I1FW 20% 18% 16% 14% 12% 10% 8% 6% 4% 2% 0% 20% 18% 16% 14% 12% 10% 8% 6% 4% 2% 0% 20% 18% 16% 14% 12% 10% 8% 6% 4% 2% 0% O2FW «tilting» O2BW «yawing» O2C Out-of-Plane Modal Damping Less Reliable
Experimental OMA vs. FEM T1FA T1SS O2FW OMA FEM • 8 of 15 identified modes paired (below 5 Hz) • MAC > 50% • frequency difference < 10% O1BW T2SS T2FA Useful for Mode Naming and Physics Understanding
OMA vs. Aeroelastic models (1/2) OMA = marks Aero-Elasticmodel= solidlines o O3FW o I2FW o I2BW xO3C xO3BW xI1C Frequency + T2FA + T2SS x O2FW + O2C + I1FW + O2BW + I1BW O1 *T1FA * T1SS RPM Overall Agreement (Tower 1st & In-Plane modes better)
OMA vs. AEro-elastic models (2/2) T = Tower FA = Fore-AftSS = Side-SideI = In-PlaneO = Out-of-PlaneBW/FW = Backward/Forward Whirling Damping Reasonably Correlated (In-Plane/TSS better)
Conclusions • Experimental based OMA successfully performed • Valuable insight of Wind Turbine Dynamics available • Modal Frequency, Shape and Damping identified • Correlation found with Numerical Models MW-Turbine dynamics is well characterized
FutureApplications of OMA • Optimization of Data acquisition • Minimizing number of sensors • Optimum sensor location • Measurements on Blades • Improvement of observability • Better estimation of damping • OMA of HALIADE 150 6MW …towards Larger Wind Turbines
Thank you for your attention! www.power.alstom.com