Download
1 / 33
330 likes | 506 Views
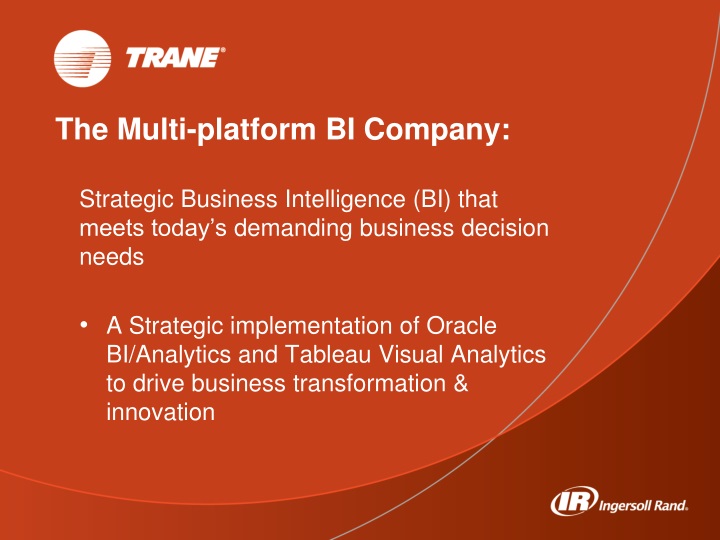
The Multi-platform BI Company:. Strategic Business Intelligence (BI) that meets today’s demanding business decision needs A Strategic implementation of Oracle BI/Analytics and Tableau Visual Analytics to drive business transformation & innovation. Speakers. Sean Otto

E N D
The Multi-platform BI Company: Strategic Business Intelligence (BI) that meets today’s demanding business decision needs A Strategic implementation of Oracle BI/Analytics and Tableau Visual Analytics to drive business transformation & innovation
Speakers • Sean Otto • Email: sean.otto@trane.com • Customer Satisfaction Analyst, Market Intelligence, Climate Solutions • David Orr • Email: David_Orr@irco.com • IT Leader, Global B/I Analytic, Climate Solutions, Information System
Who We Are • A $14 billion diversified industrial company • Over 58,000 employees worldwide • About 83 manufacturing facilities worldwide • Operations in every major geographic region • Strategic brands are #1 or #2 in their markets
Worldwide Commercial and Residential HVAC Equipment Worldwide transport refrigeration Air compressors, air and power tools Lock and door hardware, security solutions Manufacturer of golf cars and utility vehicles Ingersoll Rand: Market-leading Brands Comfort and Climate Control Brands Our Brand Promise: We inspire progress by unleashing the potential of people and technologies. Our people, products, systems and services make everyday living healthier, safer, more energy efficient, productive and comfortable—enabling our customers to achieve real progress and create a positive impact in their world. Industrial Brands Security Brand
Overview: • Background • Challenges that corporate IT teams and the business currently experience • How we developed our strategic vision for BI • What we learned and implemented • Where are we going with BI regionally and globally • How we use Tableau in the business • A little bit of show and tell. • Goal: help you learn some ways to advocate for a multi-platform system.
The Tableau Beginnings • Challenge • 3 different transactional customer experience surveys for 20+ different districts & 50+ different office locations • Minimum of 20 hours a month to design a basic excel report that provided minimal information • Not a significant business priority to get on the integration list for Oracle Business Intelligence (OBI) • Data wasn’t communicated or used in the business • Our customer’s were being forgotten…..
The beginnings contd. • Solution • Used Tableau to create a monthly Customer Experience report (show and tell later) • After 3 months we had 200+ regular monthly users of the report with increased message communication • Conclusion: • We found significant success using Tableau for secondary data and looking at the current IT footprint developed a new IT footprint that included Tableau Server. “When I first saw the new reports I thought it was just a flavor on an old box, but it has taken me 9 months before I realized that there is extreme business value in this report.” - Territory VP
Technology in society • In a few hundred years, when the history of our time is written from a long-term perspective, it is likely the most important event historians will see is not the technology, but the unprecedented change in the human condition. For the first time, people have choices.” • Peter F. Drucker
What we mean by Business Intelligence • Intelligently applying available business data to derive insight and improve decision making at all levels of the business • This can come from highly strategic and governed processes • Aggregate data of large volumes • This can come from ad-hoc queries or secondary data sources • Nuanced detail
Why is information and analysis so important? Predictive Analytics Level of Skill Required What Will Happen? Prescriptive Analytics What is the best course of action? Diagnostic Analytics Descriptive Analytics Why Did it Happen? What Happened? Level of Business Impact
What is IT, really? A governed, systemic process for data management
The yin & yang of IT and the business Data Business Unit Department(s) / Analysts IT Department
Historical challenges with BI Centralized / Controlled Decentralized / Autonomous Ad Hoc Query / OLAP Data Discovery Data DumpsExcel / Access Interactive Reports Static Reports The elusive sweet spot • Casual Users (~80%) • Can’t find the right report • No single version of the truth • Slow response times • Too complex to use • Business moves too fast • Power Users (~20%) • Create lots of reports • Create inconsistent reports • Create runaway queries • Waste time & money
Challenges from the IT perspective • Empower Business Units • Drive analytics based decision making • Anywhere / Anydata • Create organizational relationships • How do we manage resources effectively so the system
Challenges from the Business Units • Connect with relevant data sources • Understand and communicate business insight • Avoid the deluge of miscellaneous reports • Speed up the process • Improve communication and utilization of data
IT led BI vs. Self-Service BI “Um, why should I rely on you, if there are tools out there that I can use myself and purchase for my team?”
Fixed format Reporting &Publishing (BIP) The Strategic vision of BI Rapid-fire data visualization & Fast visual analytics Standard KPI’s & information Interactive Dashboards, Alerts, ad hoc analysis Common Enterprise Information Model /Analytics foundation Data Marts CS Global ODS Oracle BI Server/BI Apps (ERP/CRM) All data sources, incl. Excel, Access, external, Hadoop DataWarehouse Data Mart Oracle PeopleSoft, Siebel, Custom Apps Files Excel XML Business Process OLTP & ODS Systems
Trane’s new perspective on BI Centralized / Controlled Decentralized / Autonomous Data DumpsExcel / Access Static Reports Ad Hoc Query / OLAP Data Discovery / Visual Analysis Interactive Reports Oracle BI Tableau Sweet spot A Sweet spot B • Power Users (~20%) • Create consistent reports • Save time & money w/ improved efficiencies • Need to visualize data for effective communications • Casual Users (~80%) • Single version of the truth • Mobile/Tablet Capable • “Tailored delivery”
Where do BI/Analytic tools fit in to the information and analysis process? Other vendors Prescriptive Analytics Competitive advantage What Will Happen? Predictive Analytics Tableau Diagnostic Analytics What is Happening? Oracle BI Descriptive Analytics Why Did it Happen? What Happened? Level of Business Impact/ Degree of Intelligence
Tableau Server Goals The main objective of Tableau Server is to: • Move to a more proactive data discovery, analysis, forecasting & insight generation • Increase security and availability • Increased data quality, accuracy & reliability • Enable business units to be less dependent upon IT report generation and more integrated with IT on data oversight
Tableau Visual analytics - A governance/process based implementation plans • Without a strategy that is centered around standards Chaos can ensue • Oversight is necessary and cross communication between IT and BU • Oversight is necessary within Business Units
Tableau implementation Challenges • Which BU gets first dibs? Whose next? • What is our expected use forecast? • What type of oversight is needed on the Business Units? • Including establishing a governance / taxonomy • What type of oversight is needed for the IT working with Tableau Server • What is the communication strategy? • For IT? • For the Business Units? • For the End Users? • Let’s define the playground… • Who gets what? When? And Why?
BI/Analytics Framework - Guidelines Tableau is NOT meant to replace OBI Oracle BI Tableau Reports not available in OBIEE Reports on data not connected to OBIEE Reports for ad-hoc data Higher quality of data visualization needed Data Discovery / hypothesis testing • Core business transactional system data • Financial data / forecasts / sales / margins • Cross-sector data reports and dashboards • S.M.A.R.T. Transformation
Changes in governance models IT Governance BI Tableau Governance BU Need new skills Analyst Training Server Data feeds / collaboration Super user Training End User Training Requests for Licenses Requests for Server Access / configurations Tableau user community Weekly best practices • Nothing really changes on the data governance side • IT needs training on what Self-Service BI is all about
Differences between Oracle and Tableau Data Governance Oracle OBIEE Tableau Rapid Report generation based upon the needs of the business unit, creating multiple self-service queues within each business unit IT Tasks Data Reliability Data Integrity Data Monitoring Data Oversight BU Tasks Report Generation Report Oversight Data consumption Report generation managed through a hierarchical queue of business importance. • IT tasks: • Data Reliability • Data Integrity • Data Monitoring • Data Oversight • Report Generation • Report Oversight • BU Tasks: • Data Consumption
Internal Support Systems • Internal Request Systems • MyRequest • For Desktop licenses requests – Requires 15 min training course • For User access on the Server • For Database connectivity requests • MyTicket • For data connectivity issues • For any Tableau Server Issues • Education - IRU • Course on Tableau Server Usage • Course on Desktop Use • IR Tableau Strategy • Monthly Best Practices within IR • Internal wiki for learning and development
Communication Strategies • IT Oversight team – Monthly meeting • Work on data connectivity issues • Assess server load / access issues • BU requests • Business Unit Oversight teams – Monthly meetings • Made up of Tableau Super Users • Individuals with vested interests in Tableau Reports • Best practices • Tableau usage / connectivity issues • Tableau Community
Challenges in maintaining the dual infrastructure • Challenges with Self-Service BI & maintaining the momentum. • Internal communications • Training users on data visualization • Not everyone “sees” the utility of visualizing data • Keeping leadership informed on the value it is providing • Leadership support has been key in advocating strategy for Oracle and Tableau • Playing nicely in the sandbox with IT • Sometimes ‘No’ is a good answer.
Where are we today and where are we going? • Timeline: • Q3 2012 to Q1 2013 – Roll-out to different North American Region functional units • Customer Experience (CX) • Parts Operations • Service Operations • Finance • 2013 Global deployment • Latin America • EMIEA • Asia Pacific • Early to Mid 2013 additional IR Sector deployment
Contact info • Sean Otto - Business Leader, Analytics • David Orr – IT Leader, BI/Analytics • Sanjeev Addala, Sr. Director, Information Technology