
Probability
Probability Student Outcome: I will be able to write probabilities as ratios, fractions and percents. Probability : is the likelihood or chance of an event occurring. Outcome : any possible result of a probability event. Favourable Outcome : a successful result in a probability event.

Probability
E N D
Presentation Transcript
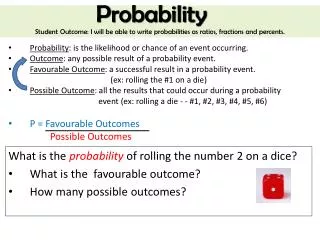
Probability Student Outcome: I will be able to write probabilities as ratios, fractions and percents. • Probability: is the likelihood or chance of an event occurring. • Outcome: any possible result of a probability event. • Favourable Outcome: a successful result in a probability event. • (ex: rolling the #1 on a die) • Possible Outcome: all the results that could occur during a probability • event (ex: rolling a die - - #1, #2, #3, #4, #5, #6) • P = Favourable Outcomes • Possible Outcomes • What is the probability of rolling the number 2 on a dice? • What is the favourable outcome? • How many possible outcomes?
How to express probability Student Outcome: I will be able to write probabilities as ratios, fractions and percents. • Probability can be written in 3 ways... • As a fraction = 1/6 • As a decimal = 0.16 • As a percent • 0.16 x 100% = 16% • How often will the • number 2 show up • when rolled?
Determine the probability Student Outcome: I will be able to write probabilities as ratios, fractions and percents. • First you must find the possible outcomes (all possibilities) • and then the favourable outcomes (what you’re looking for). • Then place them into the probability equation. • Rolling an even number on a die? • Pulling a red card out from a deck of cards? • Using a four colored spinner to find green? • Selecting a girl from your class? • P = Favourable Outcomes • Possible Outcomes
Determine the probability Student Outcome: I will be able to write probabilities as ratios, fractions and percents. • A cookie jar contains 3 chocolate chip, 5 raisin, 11 Oreos, • and 6 almond cookies. Find the probability if you were to • reach inside the cookie jar for each of the cookies above.
Determine the probability Student Outcome: I will be able to write probabilities as ratios, fractions and percents. • A cookie jar contains 3 chocolate chip, 5 raisin, 11 Oreos, • and 6 almond cookies. Find the probability if you were to • reach inside the cookie jar for each of the cookies above.
Determine the probability • Page 163-164 # 3, 5, 7, 10 • Extend: Page 163 #11, 12
Practical Quiz #1 • Letter tiles for the word CINCINNATI are placed in a bag. • What is the probability of drawing the letter C? • What is the probability of drawing the letter N? • What is the probability of drawing the letter O?
Organized Outcomes Student Outcome: I will be able to create a sample space involving 2 independent events. • Independent Events: • The outcome of one event has no effect on the outcome of another event • Example: ROCK PAPER SCISSOR Tails Head
Chart Student Outcome: I will be able to create a sample space involving 2 independent events. • Sample Space: • All possible outcomes of an event/experiment • (all the combinations) • coin • hand • What is the probability of Paper/Head? • What is the probability of tails showing up?
“Tree Diagram” to represent Outcomes Student Outcome: I will be able to create a sample space involving 2 independent events. H T Coin Flip R P S R P S Rock, Paper, Scissor H, Rock T, Rock H, Paper T, Paper H, Scissor T, Scissor Outcomes
“Spider Diagram” to represent Outcomes Student Outcome: I will be able to create a sample space involving 2 independent events. Rock Rock Paper Paper Scissor Scissor
Organized Outcomes Student Outcome: I will be able to create a sample space involving 2 independent events. • You can find the sample space of two independent • events in many ways. • Chart • Tree Diagram • Spider Diagram • Your choice, but showing one of the above • illustrates that you can find the favourable and • possible outcomes for probability.
Organized Outcomes • Page 169-170 #5, 8, 9, 10 • Extend: Page 170 #13, 14
Probabilities of Simple Independent Events Student Outcome: I will learn about theoretical probability. • Random: • an event in which every outcome has an equal chance of • occurring. Problem: • A school gym has three doors on the stage and two back • doors. During a school play, each character enters through • one of the five doors. The next character to enter can be • either a boy or a girl. Use a “Tree Diagram” to determine • to show the sample space. Then answer the questions on • the next slide!
Probabilities of Simple Independent Events Student Outcome: I will learn about theoretical probability. • Random: • an event in which every outcome has an equal chance of • occurring. • See Page 172 for your “Tree Diagram” of the school gym • doors!
Using a Table to DETERMINE Probabilities Student Outcome: I will learn about theoretical probability. • How to determine probabilities: • Probability (P) = favourable outcomes • possible outcomes • = decimal x 100% • Use your results from the “tree diagram” of the gym doors • and place them into a chart. Then determine the • probabilities for the chart.
Using a Table to DETERMINE Probabilities Student Outcome: I will learn about theoretical probability. • Determine the probability for the scenarios below... • 1. Of a boy using any right door? • 2. Of anyone (boy or girl) using a stage door? • 3. Of a girls using any of the doors?
Determine Probabilities • Page 175-176 #6, 9, 12, 13 • Extend: Page 176 #14
Practical Quiz #2 • On the front of the paper: • Draw a sample space using a chart for the following events. • On the back of the paper: • Draw a sample space using a tree diagram for the following events. • Rolling a 4 sided die and flipping a quarter.
Applications of Independent Events Student Outcome: I will learn about theoretical probability. • Let’s play “Sit & Save?” • (page 177) • RULES: • Stand up at the beginning of the round. • Two dice are rolled each round. You may collect the sum of your dice as long as a “6” does NOT appear. A “6” means all numbers before are cancelled and you get zero for that round. • After each roll you have two choices • Continue standing and roll again…hoping for no “6” • OR • Sit and collect your total points!
Applications of Independent Events Student Outcome: I will learn about theoretical probability. • How can you win at the game of “Sit & Save?” • Who had the highest score? • What is the possibility of a 6 appearing with 2 dice? (sample data) • Use the numbers above for each player to find who had the best probability (percent) of not rolling a 6. Total
Total Total
Interpret Outcomes Student Outcome: I will learn about theoretical probability. • Use Tree Diagrams, Charts or other graphic organizers to solve • probability problems. • What are the 2 independent events? • What is the probability of the sum of these 2 events adding up to total “4”… • What is the probability of outcome having one 3 appear?
Interpret Outcomes Student Outcome: I will learn about theoretical probability. • What is the probability of red appearing? • What is the possibility of a black and green appearing? • 3. What is the possibility of brown mirror appearing?
Interpret Independent Outcomes • Page 181-182 #4, 6, 8, 9 • Extend: Page 182 #11
Theoretical vs. ExperimentalProbabilities Student Outcome: I will be able to compare experimental and theoretical probability. • What are the chances of a boy and girl picking the same number • from 1-5. Try this 10 times and tally your results (experimental). • Then compare to your “theoretical”answer. experimental The probability of an event occurring based on experimental results. A tally chart will be required. The expected probability of an event occurring. Theoretical
Theoretical vs. ExperimentalProbabilities Student Outcome: I will be able to compare experimental and theoretical probability. • You must complete 2 of the 3 activities listed. • For each activity you must compare the theoretical and experimental • probabilities. Each experimental probability must be done 50 times. • Then compare to your “theoretical”answer. • Activities • Flipping a coin and using a spinner. • Rolling one 6-sided die and dropping a cup. • Rolling two 6-sided dice.
Theoretical vs. ExperimentalProbabilities • Page 187-189 # 4, 6, 7, 9, 11
Practical Quiz #3 • When these two independent event are done at the same time, What is the probability of getting: • a)anything with red? • b) orange-tails?
Are your ready to be TESTED on “Probability?” • We have covered a lot of material in this unit. Do you have any • concerns or questions about any of the topics below? • Representing probability in different ways… (Pg. 158) • Types of sample spaces to find the probability (Pg. 166-167) • Explain how to identify an independent event. • Determine the outcomes of two independent events. (Pg. 172) • Find the sum of different events…which sample space would be best to use? • Solve multiple probabilities… P(1,B) or P(Girls, Boys, 6) • Use diagrams to interpret data and probabilities. (Pg. 178-179) • Compare experimental to theoretical probabilities. (Pg. 184) • Outcome – any possible result of a probability experiment. • Favourable Outcome – a successful result in a probability experiment. • Probability – the likelihood of an event happening. • Random – when every result has an equal chance of occurring. • Sample Space – all possible outcomes of a probability experiment. • Tally Chart – an area to record information during experimental probability.
Are your ready to be TESTED on “Probability?” • We have covered a lot of material in this unit. Do you have any • concerns or questions about any of the topics below? • Representing probability in different ways… (Pg. 158) • Types of sample spaces to find the probability (Pg. 166-167) • Explain how to identify an independent event. • Determine the outcomes of two independent events. (Pg. 172) • Find the sum of different events…which sample space would be best to use? • Solve multiple probabilities… P(1,B) or P(Girls, Boys, 6) • Use diagrams to interpret data and probabilities. (Pg. 178-179) • Compare experimental to theoretical probabilities. (Pg. 184)
Chapter Review • Page 190 – 191 • #1-14
Game – Baseball Dice • Handout playing field to students and dice.


