Download
1 / 26
260 likes | 350 Views
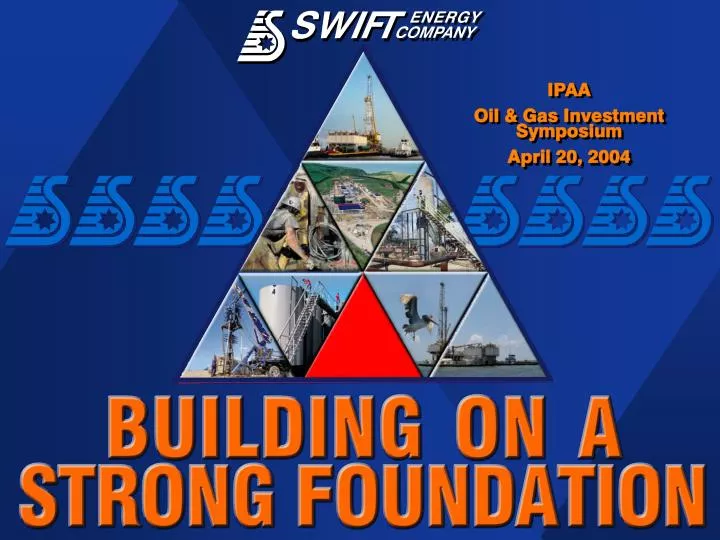
IPAA Oil & Gas Investment Symposium April 20, 2004. Forward Looking Statement.

E N D
IPAA Oil & Gas Investment Symposium April 20, 2004
Forward Looking Statement This material includes “forward-looking statements” within the meaning of Section 27A of the Securities Act of 1933, as amended, and Section 21E of the Securities Exchange Act of 1934, as amended, prepared by the Company. The opinions, forecasts, projections or other statements other than statements of historical fact, including, without limitation, estimates of proved reserves of oil and gas, reserve potential and plans and objectives of management of the Company for financing, are forward-looking statements. Although the Company believes that the expectations reflected in such forward-looking statements are reasonable, it can give no assurance that such expectations will prove to have been correct. Certain risks and uncertainties inherent in the Company’s business are set forth in the filings of the Company with the Securities and Exchange Commission.
Strategic Overview Domestic Operations New Zealand Operations Financial Review Building on a Strong Foundation
Corporate Profile • Founded in 1979; Celebrating 25th Anniversary • (NYSE: SFY) 27.5 MM shares outstanding • Focused operations • 6 core areas in U.S. & New Zealand • High level of operating control – 95% • Balanced reserve base ~ 820 Bcfe (136.7 MM BOE) • 47% crude oil; 41% natural gas; 12% NGLs • 59% developed; 41% undeveloped • Geological & geographical diversification
Stable asset base ~ 15 year R/P ratio Expanding reserve base Proven track record of growth --Replaced over 270% of production over the past 5 years --F&D cost of ~$1.25/Mcfe over the past 5 years Conservative capital structure Experienced, disciplined management team Corporate Profile
Tandem approach: drilling & acquisitions Repeatable method of operations Focus on multiple horizons Exploitation with exploration upside Reduce operating risk Maintain R/P, improve production profile Maximize operational control Balance and diversify reserve base Limit financial risk Maintain conservative balance sheet Ensure comfortable liquidity Active price risk management Corporate Strategy
2003 Year-end Reserves ~ 30 Mcfe per Share23-Year Growth Rate = 26% 10-Year Average Debt/Mcfe = $0.38 Mcfe 35 32.3 31.4 30 $1.00 25 Mcfe/Share 20 0.80 Trend Debt/Mcfe 0.60 15 10 0.40 5 0.20 0 0 90 80 82 84 86 88 92 94 96 98 00 02 04E Long-Term Reserve Growth
Proved Undeveloped 337 Bcfe Brookeland Masters Creek Corporate 820 Bcfe AWP Olmos Lake Washington Rimu/Kauri 13% TAWN Other 9% Proved Developed 483 Bcfe 4% 3% 8% 4% Note: 12/31/2003 estimates Swift Reserves Breakout
Brookeland Q4 2002 Masters Creek Q4 2001 AWP Olmos Lake Washington Rimu/Kauri TAWN Other Q4 2003 SFY Production Changes
100% 80% 60% 40% 20% 0% $6.50 $6.00 $5.50 $5.00 $4.50 $4.00 $3.50 $3.00 $2.50 $2.00 $1.50 % of Annual Reserves Added through Acquisitions & Drilling SFY Composite Sales Price 81 83 85 87 89 91 93 95 97 99 01 03 Drilling Acquisitions SFY Composite Sales Price Drilling & Acquisitions A Tandem Approach
Strategic Overview Domestic Operations New Zealand Operations Financial Review Building on a Strong Foundation
Masters Creek 2003 Production: 5 Bcfe 2003 Reserves: 63 Bcfe Brookeland 2003 Production: 3 Bcfe 2003 Reserves: 44 Bcfe 1-2 Dev. Wells 1 Dev. Well Lake Washington 2003 Production: 13 Bcfe 2003 Reserves: 261 Bcfe Core Areas Austin Chalk Woodbine Wilcox Frio Miocene Yegua Edwards Vicksburg 25+ Dev./2+ Exp. Wells AWP Olmos 2003 Production: 9 Bcfe 2003 Reserves: 215 Bcfe 15-18 Dev. Wells 10 Fracture Enhancements Domestic Core Areas - 2004
Facility Capacities* (MB/d) Producing Wells ~95 20 20 77 9 34 22 18 4 2 * Combination of 3 platforms, pipeline & barge capacity Net Production Exit Rate (MBoe/d) Reserves (MMBoe) ~12 ~47 43.5 9 31.7 3.5 12.1 7.7 0.85 0.75 Mar 2001 Dec 2001 Dec 2002 Dec 2003 Dec 2004E Mar 2001 Dec 2001 Dec 2002 Dec 2003 Dec 2004E Lake Washington Operations
Strategic Overview Domestic Operations New Zealand Operations Financial Review Building on a Strong Foundation
MMcf/d Shortfall Expected Decline Kupe Maui Pohokura Kapuni NZ Natural Gas Market-Supply Source: Crown Minerals; Swift Estimates
Two Core Areas Rimu/Kauri & TAWN Mangahewa Field • ~176 Bcfe of proved reserves • (53% gas, 64% developed) • Significant Probable and • Possible reserves • Rimu/Kauri • Tawa • Matai • TAWN • Long-term gas contracts in place 38718 Kaimiro Field Egmont National Park TAWN Fields Kapuni Field 38716 38756 Taranaki Basin 38759 38719 New Zealand Rimu/Kauri Area Swift Energy NZ Core Holdings
Methanex Waitara New Plymouth Tariki Ahuroa TAWN Assets Ngaere Oaonui Production Station Waihapa Waihapa Production Station • Rimu Production Station • 3,500 B/d oil capacity • 10 MMcf/d gas capacity • Completed April 2002 for $25 MM Hawera Rimu Production Station Taranaki Basin Infrastructure • TAWN Processing Infrastructure • Significant excess capacity • 60 MMcf/d gas capacity • 15,000 B/d oil capacity • Facilities integrated to Markets • 32-mile oil pipeline • 32-mile gas pipeline
Strategic Overview Domestic Operations New Zealand Operations Financial Review Building on a Strong Foundation
$ in Millions As of Dec. 31, 2002 $ in Millions As of Dec. 31, 2003 Bank Borrowings -- 0% 16 2% 2009 Sr Sub Notes 10 1/4% 124 18% 124 17% 2012 Sr Sub Notes 9 3/8% 200 29% 200 27% Total Debt 324 47% 340 46% Stockholders’ Equity 365 53% 397 54% Total Capitalization 689 100% 737 100% Capitalization
Domestic vs International Spending by Activity $130-150 MM Prospect Cost New Zealand New Zealand ~20% Exploration Discretionary Spending Development Drilling Domestic ~80% 2004 Capital Budget
$ in Millions 2003 2004E Domestic Activity $ 3 - 8 Exploratory $ 7 Development 113 95-110 $ 120 $ 98-118 Prospect Cost $ 12 $ 10-15 (3 -13) Acquisitions/Dispositions (12) 31 25-30 New Zealand $ 151 $ 130-150 Total Capital Expenditure Budget
Proved Reserves (Bcfe) Annual Production (Bcfe) 62 59 890 860 Historical 6% 5YR CAGR Historical 14% 5YR CAGR 53 820 50 749 45 43 42 646 629 455 99 00 01 02 03 04E 99 00 01 02 03 04E Natural Gas Oil Asset Growth
(Dollars in Millions) $262 $249* Revenues EBITDA $184 $173* $208 $157 $192 $184 $141 $137 $150 $98 $111 $87 Historical 21% 5 YR CAGR Historical 17% 5 YR CAGR 99 00 01 02 03 04E 99 00 01 02 03 04E Revenue & EBITDA# Growth *2004 estimates assumes production guidance (59 & 62 Bcfe) and; Q1 estimates and (WTI 30.00 & HH 5.00 /MMBTU ) for remainder of 2004. # EBITDA definition referenced on Swift website guidance page
Focused Operations High Level of Operating Control Balanced Reserve Base Stable Asset Base Expanding Reserve Base Proven Track Record of Growth Conservative Capital Structure Experienced, Disciplined Management Team Investment Highlights
$ in millions, except per share amounts Oil Price +/- $1.00/Bbl Gas Price +/- $0.10/Mcf EBITDA 2.5 4.6 Cash Flow 2.5 4.7 Per Share0.09 0.17 Net Income 1.7 3.0 Per Share (basic) 0.06 0.12 Per Share (fully diluted) 0.06 0.11 $ $ Based on 62 Bcfe Production case Sensitivity Analysis - 2004 0utlook