Download
1 / 37
370 likes | 491 Views
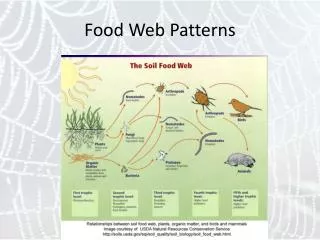
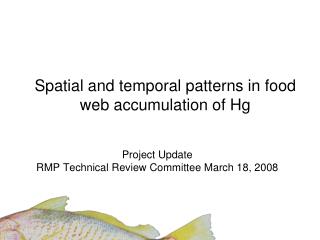
Spatial and temporal patterns in food web accumulation of Hg. EEPS Five Year Workplan Presentation to Exposure and Effects Work Group. Talk outline. Review workplan Results update Questions for EEWG and Science Advisory Panel Questions on small fish work Other potential studies.

E N D
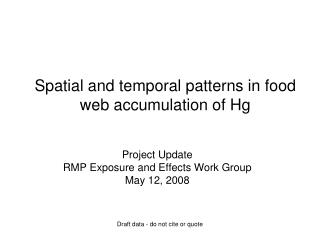
Spatial and temporal patterns in food web accumulation of Hg EEPS Five Year Workplan Presentation to Exposure and Effects Work Group Draft Data - Do not cite or quote
Talk outline • Review workplan • Results update • Questions for EEWG and Science Advisory Panel • Questions on small fish work • Other potential studies Draft Data - Do not cite or quote
Five Year Workplan: Specific questions to address • Where is mercury entering the Bay food web? • What habitats, conditions, or factors help to identify hotspots of food web accumulation in Bay margins? • Are there interannual trends in MeHg bioaccumulation resulting from wetland and margin restoration activities? • What are the best biomonitoring tools for characterizing hotspots of MeHg bioaccumulation? Draft Data - Do not cite or quote
Approach: Hg in small fish • Annual monitoring at 10 stations to determine trends • Spatial survey of about 40 stations • Comparison of biosentinel tools (pending first year results) • Fish vs. bivalves vs. sediment vs. diffusive gradient thinfilm devices Draft Data - Do not cite or quote
Annual monitoring of trend stations Draft Data - Do not cite or quote
Trend Sampling Locations Hamilton Benicia Park China Camp Control Point Isabel Impact (Restoration) Oakland Middle Harbor Candlestick Point Eden Landing Bird Island/ Steinberger Slough Newark Slough Alviso Slough Draft Data - Do not cite or quote
Trend analysis – a multiple station BACI design Draft Data - Do not cite or quote
Spatial survey • Targeting 40 locations • Multiple interrelated factors • Land use, land cover, and Hg sources • Spatial location in Bay • Subtidal hydrology and bathymetry • Sediment physical and chemical parameters Draft Data - Do not cite or quote
Results updatePreliminary results from 2005 and 2006 • Spatial patterns • Interannual trends • Focusing on topsmelt and Mississippi silverside (most complete spatial coverage) Draft Data - Do not cite or quote
Spatial patterns • 2005 elevated in southern stations (significant) Hg wet weight (g/g) • 2006 elevated in Pt. Isabel (significant) Draft Data - Do not cite or quote
2005 elevated in southern stations (not significant) • 2006 elevated in southern stations, Pt. Isabel, and Tiburon (significant) Draft Data - Do not cite or quote
Potential explanations for spatial patterns: • High sediment MeHg in southern stations, Tiburon • Suggests linkage: fish vs. sediment MeHg • Suggests spatial gradient Draft Data - Do not cite or quote Source: RMP
Interannual trendsMississippi silverside • Station effect • Year effect • Interaction term Draft Data - Do not cite or quote
Station effect Draft Data - Do not cite or quote
Year effect and interaction Draft Data - Do not cite or quote 2006 generally lower than 2005
Interannual trendsTopsmelt • Station effect • Year effect Draft Data - Do not cite or quote 2006 higher than 2005!
Results update summary • Ability to detect significant spatial variation • South Bay, Tiburon, Pt. Isabel appear elevated • Substantial interannual variation • Topsmelt and silverside “seeing” different MeHg signals • Subtle treatment effects likely missed • Biosentinels sensitive to changes Draft Data - Do not cite or quote
Questions to Advisory Panel Design considerations • Habitat types: Bay margins vs. wetlands and salt ponds • Design – probabilistic vs. gradients and factors • Collection of additional parameters Draft Data - Do not cite or quote
1. Collection of additional habitats • Small fish sampling has focused on Bay margins (foreshore) • Limited sampling on wetlands and salt ponds • Area of avian wildlife risk • Greater variability in MeHg • May provide clues as to sources • Question to Science Advisory Panel: What percent of budget allocation to margins vs. wetlands and salt ponds? Draft Data - Do not cite or quote
2. Design – probabilistic vs. gradients and factors • Gradient and factor design • Select specific attributes expected to be important for Hg exposure • Allows for explicit hypothesis testing Draft Data - Do not cite or quote
Probabilistic design • Following EPA Generalized Random Tessellation Stratified (GRTS) or some other Spatially-Balanced Survey Design • Bay margin samples chosen along a line tracking bay shoreline • Ensure selection of representative conditions • Determine gradient of relevant parameters for selected sites Draft Data - Do not cite or quote
Question to Advisory Panel • Which design (factor vs. probabilistic) more appropriate for this project? Draft Data - Do not cite or quote
3. Collection of additional parameters • Aimed at better understanding mechanisms for spatial variation in bioavailable Hg • Trade off is reduced number of stations • Potential parameters: • Sediment parameters: redox, TOC, grain size, MeHg • Water parameters: TSS, nutrients, chlorophyll • Bathymetry and hydrology: more detailed bathymetric profile and water retention time data • MeHg via Diffusive Gradient Thinfilm devices • Recommendation for Advisory Panel to consider – collect ancillary parameters for subset of 20 - 30 stations Draft Data - Do not cite or quote
Questions – shifts in emphasis • Including other contaminants in small fish surveys • Studies of food web contaminant uptake Draft Data - Do not cite or quote
Inclusion of other contaminants in small fish surveys • Current workplan focuses on MeHg • Top management priority • Uncertainty of food-web uptake hotspots • Not well characterized by other RMP analyses • Cost leverage (analytical costs ~10x less) • Recommendation for Advisory Panel to consider – not include other contaminants in surveys Draft Data - Do not cite or quote
Studies on mechanisms of contaminant uptake into food web • Topics that could be evaluated: • Food-web structure • Relative role of sediments vs. the water column as transport pathways of contaminants to biota • Spatial areas that biosentinel species integrate • Spatial variation in food-webs diet Contaminant uptake • Currently, not in work plan or anywhere in RMP Draft Data - Do not cite or quote
Source: Bridges et al. 2006 Draft Data - Do not cite or quote
Available Approaches • Review literature and local data from other agencies • Dietary analysis of predators (current studies) • Stable isotope analysis • Food web and contaminant modeling • Linkage to contaminant fate and transport models • Models of spatial movement of contaminants in fishes and other biota Draft Data - Do not cite or quote
Examples of results:1. PCBs in shiner perch as a function of spatial variation in diet Draft Data - Do not cite or quote Source: Gobas, F. A. P. C., and J. Wilcockson. 2002. San Francisco PCB food-web model. RMP Technical Report SFEI Contribution #90
Examples of results:2. Water vs. sediment contribution of PCBs Draft Data - Do not cite or quote Source: Greenfield, B. K., A. R. Melwani, J. J. Oram, and S. M. Bay. 2007. Indicator development and framework for assessing indirect effects of sediment contaminants. SFEI Contribution #524
Examples of results:3. Stable isotope (trophic position) vs. Hg in sport fish Draft Data - Do not cite or quote Source: Greenfield, B. K., J. A. Davis, C. Roberts, R. Fairey, M. A. Sigala, and J. Negrey. 2002. The relationship between trophic position, spatial location, and contaminant concentration for San Francisco Bay sport fish: a stable isotope study. Unpublished manuscript
Question to Advisory Panel • Should we incorporate studies on mechanisms of food web contaminant uptake? • Currently no effort • Could allocate 10 – 20% of effort to process studies (isotopes/diet analyses) and modeling Draft Data - Do not cite or quote
Summary of questions to Work Group and Advisory Panel (spatial and temporal patterns in food web accumulation) • What percent of budget allocation to margins vs. wetlands and salt ponds? • Which design (factor vs. probabilistic) more appropriate for this project? • Do you agree with recommendation to collect ancillary parameters on subset of stations? • Do you agree with recommendation not to include other contaminants in small fish sampling? • Should some effort (e.g., 10-20% of budget) be allocated towards studying processes of food web uptake? Draft Data - Do not cite or quote