Download
1 / 8
80 likes | 336 Views
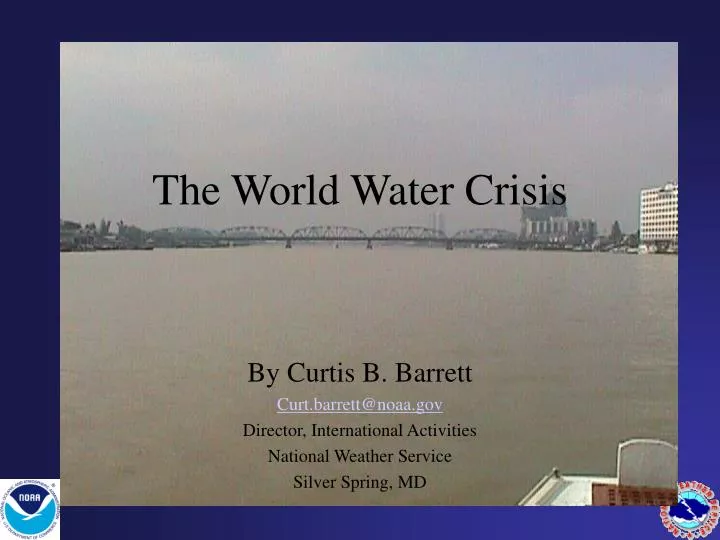
The World Water Crisis. By Curtis B. Barrett Curt.barrett@noaa.gov Director, International Activities National Weather Service Silver Spring, MD. Four day loop Hurricane Mitch. World Water Crisis. By 2010 over 50% of global runoff claimed

E N D
The World Water Crisis By Curtis B. Barrett Curt.barrett@noaa.gov Director, International Activities National Weather Service Silver Spring, MD
World Water Crisis • By 2010 over 50% of global runoff claimed • World population will increase up to 10 billion by 2050 • Water use competition is intensifying between Agriculture, domestic, industrial and energy • Transboundry competition for water threatens international stability (About 50% of all river basins are transboundry and involve 85% of worlds freshwater) • Polluted water, water shortages, and unsanitary conditions kill • 12 million people per year • Economic losses from weather related disasters have reached a record high- $92billion in 1998.
90 Others Economic losses 16 Flood (2001 values) 80 Windstorm of which insured losses 14 Earthquake (2001 values) 70 Trend of economic losses 12 60 Trend of insured losses 50 10 40 8 30 6 20 4 0 10 2 0 1950 1955 1960 1965 1970 1975 1980 1985 1990 1995 2000 1950 1955 1960 1965 1970 1975 1980 1985 1990 1995 2000 >167 bn US$ US$ bn Figure 1: World economic losses from 1950-2001 for great natural catastrophes (Source: Munich Re) Number Figure 2: Number of great natural catastrophes from 1950–2001 (Source: Munich Re)