Download
1 / 22
230 likes | 426 Views
I drift from ENVISAT ASAR WSM data Danish National Space Center, DTU. Leif Toudal Pedersen & Roberto Saldo Danish National Space Center Technical University of Denmark. Outline. Method Background – GMM mode images NRT Ice drift from WSM images High resolution ice drift Ice deformation.

E N D
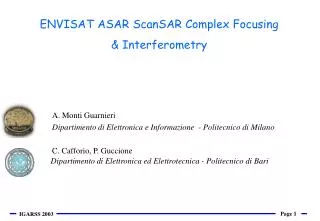
I drift from ENVISAT ASAR WSM dataDanish National Space Center, DTU Leif Toudal Pedersen & Roberto Saldo Danish National Space Center Technical University of Denmark
Outline • Method • Background – GMM mode images • NRT Ice drift from WSM images • High resolution ice drift • Ice deformation DNSC sea ice | Oct 2007 | Ltp| side 2
Method - Cross correlation • area of reference • correlation area • distance between vectors • sampling DNSC sea ice | Oct 2007 | Ltp| side 3
GMM+WSM 3-day ice drift October 16-19, 2007 Spatial resolution 35 km (GMM) Temporal resolution (3-day – GMM) DNSC sea ice | Oct 2007 | Ltp| side 4
Spatial resolution 10 km (WSM) Temporal resolution (1-day – WSM) WSM 1-day ice drift October 18-19, 2007 Spatial resolution 35 km (GMM) or 10 km (WSM) DNSC sea ice | Oct 2007 | Ltp| side 5
Accurate start and end time • Drift is calculated from swath data • All swaths from day 0 is correlated with all swaths from day 1 (or day 3 for 3-day drift) • Enables accurate start and end time contrary to using daily mosaics DNSC sea ice | Oct 2007 | Ltp| side 6
New DTU dataset available from June 1, 2007 • Daily drift vectors from all available ENVISAT ASAR WSM data • 1-day drift (12-36 hours) • 10 kilometer resolution (correlation of a circular area r=5km) • 10 kilometer grid (drift vector every 10 kilometers) • Arctic and Antarctic • Examples: (Only daily average displacements are shown) DNSC sea ice | Oct 2007 | Ltp| side 7
20070628 DNSC sea ice | Oct 2007 | Ltp| side 8
20070629 DNSC sea ice | Oct 2007 | Ltp| side 9
20070630 DNSC sea ice | Oct 2007 | Ltp| side 10
20070701 DNSC sea ice | Oct 2007 | Ltp| side 11
20070702 DNSC sea ice | Oct 2007 | Ltp| side 12
20070703 DNSC sea ice | Oct 2007 | Ltp| side 13
20070704 DNSC sea ice | Oct 2007 | Ltp| side 14
20070705 DNSC sea ice | Oct 2007 | Ltp| side 15
20070706 DNSC sea ice | Oct 2007 | Ltp| side 16
Ice drift and deformation from SAR • Application • Ice deformation (1-day, WSM, 3km resolution) • The method is applied to WSM data fro the area north of Greenland • The 10 kilometer vectors are used as seed points • A new dataset of 3km resolution is derived (3km radius of correlation area) • The ice drift field is differentiated and divergence is calculated • Divergence corresponds to opening • Convergence corresponds to ridging DNSC sea ice | Oct 2007 | Ltp| side 17
Ice deformation ENVISAT ASAR Sept 03 2007 Drift Sept 2-3 DNSC sea ice | Oct 2007 | Ltp| side 18
Ice deformation ENVISAT ASAR Sept 2-3 2007 Divergence September 2-3, 2007 Black is opening, white is ridging DNSC sea ice | Oct 2007 | Ltp| side 19
Validation • Validation with buoy data: • RMS difference to AOBP buoy drifts 750m/day for the 1-day WSM drift at 10 kilometer resolution • Movement of fast ice off East Greenland: • RMS: 80m/day for the high res ice motion (2000 obs) DNSC sea ice | Oct 2007 | Ltp| side 20
Ice drift and deformation from SAR • Displacement NOT velocity • integrated quantity • In data assimilation: don’t assimilate velocities! DNSC sea ice | Oct 2007 | Ltp| side 21
Lincoln Sea 2007 animation ENVISAT ASAR WSM animation by DTU December 27 (2006) to June 8 (2007) DNSC sea ice | Oct 2007 | Ltp| side 22