Download
1 / 7
80 likes | 202 Views
As our community faces declining enrollment and funding challenges, it's essential to reflect on the past decisions of the previous Board of Education, particularly regarding Balmoral. Many members were aware they wouldn't continue, yet critical long-term plans were made without proper community consultation. We urge the new board to engage with us positively, ensuring that our schools, particularly Balmoral, receive the attention and support they deserve. Transparency matters; together we can revitalize our education system for the betterment of all students.

E N D
Why are we shown the picture on the left when making decisions about secondary schools? NV Student Actual Population, 13-17 Before new growth! NVSD Student Forecast Population K-12 Declining enrolment declining population
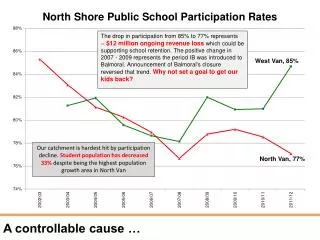
Our 6% drop in share = $4.5 million in funding NVSD is not competing well in our catchment
Why are we shown this picture … Transparency matters ...
When this is the reality…? 14 Balmoral 73 Carson Transparency matters ...
A new beginning, with a new Board • The previous Board of Education made a major decision regarding the long term plans for Balmoral which greatly affected our community • A majority of that Board knew they were not continuing on • That decision should have been made by the new board, with proper community consultation • We ask the new board, in the spirit of positive community consultation, to work with us to make Balmoral the best it can be Make Balmoral the best it can be