QBO
QBO. QBO 30 mb Zonal Wind Index. QBO 50 mb Zonal Wind Index.

QBO
E N D
Presentation Transcript
QBO QBO 30 mb Zonal Wind Index QBO 50 mb Zonal Wind Index • OTHER GLOBAL INDECESMany people like to use the QBO (The Quasi-Biennial zonal wind Oscillation) to make long range forecasts. I don't use it. This is because in the months of research that I have done on the index, I have found no clear correlation between it and anything. Things that would correlate in theory (to the 3rd degree) don't have enough analogs to verify it. For example... someone will say that a west-QBO Nino in a solar max would produce a good winter in the east. Well, there are only 1-2 analog years to work with, so you can neither prove or disprove the theory. Making forecasts based on it may work for some people, but I don't trust something that unproven. Using Solar-Min's/Max's alone doesn’t work either. For example, 97-98 and 95-96 were both Solar Min's. These were opposite winters. 94-95 was also a Solar-Min winter. There is no direct correlation.
Negative QBO and Blocking A negative (easterly) QBO helps create a blocking high over Greenland which can divert cold air south into the United States
QBO (2006) • The KEY point to consider is that if the current QBO phase stays strongly positive into the winter in any probabilities all saying significant cold air outbreaks or a colder than normal overall pattern would be significantly reduced. If on the other hand the QBO phase drops towards neutral then the overall pattern becomes much more promising for significant winter weather over much of the nation as well as the chances for more significant cold air outbreaks.
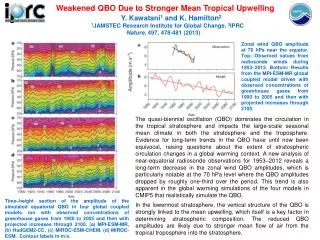
QBO (Quasi-Biennial Oscillation) “The quasi-biennial oscillation (QBO) is a band of high level zonal winds found over the Equatorial at very high altitudes (even above the Jet Stream). It is a very well known periodic oscillation in atmosphere. The has been a lot of research done over the last =10 years that shows the = QBO has significant impact of overall climate patterns ...as well as Winter Weather patterns as well as the Hurricane season. The period of the QBO "oscillation" is about (a little over) two years. The QBO has two "phases" which occur within the 1 Oscillation cycle-- the Easterly or NEGATIVE phase and the WESTERLY or Positive phase. Within the meteorological community the QBO is used heavily by SOME as a key ingredient to figuring out what the Winter pattern across North America might be...while other forecasters don’t think its all that relevant.” (DT) “The quasi-biennial oscillation is a quasi-periodic oscillation of the equatorial zonal wind between easterlies and westerlies in the tropical stratosphere with a mean period of 28 to 29 months (find QBO data since 1948 http://www.cdc.noaa.gov/Correlation/qbo.data). The best three matches to this year are 1971, 1975, 1966, however none of those were El Nino winter seasons, in fact all of them saw negative SST anomaly values.” (Misc. Pro Met)
QBO In my opinion however much of the discussion is misdirected towards how and why the QBO is important. For example it has been asserted that during the winter season....the Eastern half of the US is often cold and snowier than Normal when the QBO is in Westerly or Positive phase while others have asserted that the Easterly or Negative Phase is better for colder and snowier Eastern US winters. (DT)
QBO (2006) • It is My contention that a East or Negative Phase of the QBO as we go into the Winter months correlates to a more active and stronger Pacific Jet stream... which means more rains and storminess for the Pacific NW and West coast and a Ridge over the SE or East coast. • A QBO value that is strongly positive as we go into the Winter months...say above +10.0 or higher almost always implies a lack of cold air build up in Canada and a Milder winter for the CONUS . • A QBO value that is near zero as we go into the Winter months---say from +5.0 to -5.0 implies a Pacific Jet that is weak and favorable for all sorts of large scale pattern shifts and changes--called pattern amplification and de-amplification (lots of storms and blocking patterns) .
QBO QBO 30 mb Zonal Wind Index QBO 50 mb Zonal Wind Index OTHER GLOBAL INDECESMany people like to use the QBO (The Quasi-Biennial zonal wind Oscillation) to make long range forecasts. I don't use it. This is because in the months of research that I have done on the index, I have found no clear correlation between it and anything. Things that would correlate in theory (to the 3rd degree) don't have enough analogs to verify it. For example... someone will say that a west-QBO Nino in a solar max would produce a good winter in the east. Well, there are only 1-2 analog years to work with, so you can neither prove or disprove the theory. Making forecasts based on it may work for some people, but I don't trust something that unproven.
QBO Map Plotting and Plot for 2001-2006 Making Monthly QBO Plots Note: Arrows Indicate Time Periods in Which Philadelphia Received a Major Snowstorm. It is common for these snowstorms to occur at or near a transitional period of the QBO. For example, a rising QBO in between 2 periods of falling (FRF) or FNF, or RNF, NR, FNR