Download
1 / 1
10 likes | 144 Views
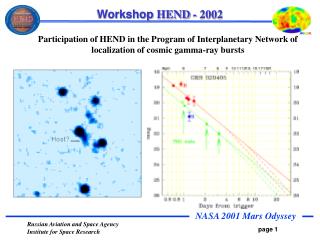
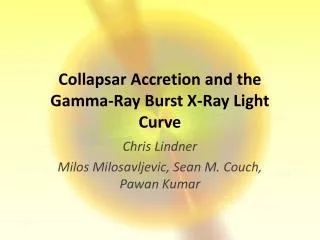
Collapsar Accretion and the Gamma-Ray Burst Light Curve. Christopher C. Lindner, Milos Milosavljevic , Sean Couch, Pawan Kumar. Texas Advanced Computing Center. The University of Texas at Austin. Abstract. Phase 0. Results.

E N D
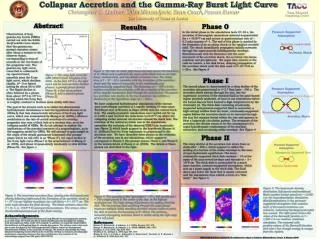
Collapsar Accretion and the Gamma-Ray Burst Light Curve Christopher C. Lindner, MilosMilosavljevic, Sean Couch, Pawan Kumar Texas Advanced Computing Center The University of Texas at Austin Abstract Phase 0 Results In the initial phase in the simulations lasts 37−52 s, the accretion of low-angular momentum material is quasiradial for r > 5×10^7 cm and occurs at quasi-constant rate of ~ 0.2 solar masses s^−1. The end of this phase is marked by the formation of an accretion shock at the smallest resolved radii. The shock immediately propagates radially outwards through the supersonically infalling stellar envelope. Simultaneously with the formation and the outer movement of the accretion shock, the accretion rate drops suddenly and precipitously. We argue that, interior to the radii we resolve, a hot disk forms, delaying propagation of the accretion shock until the disk cools to T<10^10 K at t~20 s. See Figure 3. Observations of long gamma-ray bursts (GRBs) carried out with the NASA Swift satellite have shown that the gamma-ray prompt emission ceases after about a minute in the observer frame, corresponding to tens of seconds in the rest frame of the progenitor star. The gamma-ray light curve, converted to a fiducial X-ray spectral band, smoothly joins the X-ray light curve, which declines rapidly, (t^−3 or faster) lasting for about 80 to 300 s. The Rapid decline is often followed by a phase, from about 10^3 to 10^4 s, during which the X-ray flux Figure 2: The rate at which fluid mass accretes across the boundary at R = Rmin and is added to the mass of the black hole in our high (blue), medium (red), and low (black) resolution runs. The sharp drop at t ~ 37 − 52 s coincides with the formation of the accretion shock and the onset of convection in the rotationally and hydrostatically supported fluid. The flattening at t ~ 500 s in the medium resolution run coincides with the cessation of the accretion of low angular momentum fluid through the axial funnel. The power-law accretion rate decline in the low resolution run exhibits a shallowing of the logarithmic slope at t ~ 200 s. Figure 1: The x-ray light curve for GRB 050315 from Vaughan et al. 2006. In the first 10^4 s, the light curve can be seen as three distinct phases: a prompt phase (herein Phase 0), a fast decay phase (Phase I), and a plateau phase (Phase II). Phase I The second phase is characterized by a steep decline of the accretion rate proportional to t^-2.7 that lasts ~ 500 s. The accretion shock sweeps through the star, but the supersonic accretion of the shocked fluid in the axial funnel region proceeds unabated, at least in our simulations where the funnel has not been heated to high temperatures by the relativistic jet. The thick disk containing rotationally-supported and pressure-supported fluid is convective; a high entropy outflow from the inner, rotationally-supported region follows the accretion shock on its traversal through the star but remains bound within the star and appears to form a large-scale circulation pattern. The steepness of the accretion rate decline seems to be the consequence of a rapid hydrodynamic readjustment of the shocked, convective, and circulating stellar envelope. See Figure 4. is roughly constant or declines more slowly with time. The goal of the present work is to utilize two-dimensional hydrodynamic simulations to test the hypothesis (Kumar et al. 2008a,b) that this characteristic structure of the X-ray light curve, which was summarized by Zhang et al. (2006), reflects a modulation in the rate of central accretion of a rotating progenitor star onto a black hole or a neutron star, as in the collapsar model of GRBs. We do not attempt to explore the implications of the potential presence of a magnetosphere, as in the magnetar model for GRBs. We will attempt to gain insight in the origin of the steady gamma-ray luminosity (the prompt phase which we will refer to as “Phase 0”), the rapid decline in the X-ray light curve (Phase I in the nomenclature of Zhang et al. 2006), and phase of quasi-steady luminosity or slow decline (Phase II). See figure 1. We have conducted hydrodynamic simulations of the viscous post-core-collapse accretion of a rapidly rotating 14 solar mass Wolf-Rayet star of Woosley & Heger (2006) onto the central black hole. The axially-symmetric simulations were carried out for up to 2,000 s and resolved the radii down to 5×10^7 cm where the collapsing stellar material circularizes around the black hole. The evolution of the central accretion rate in the simulations resembles the evolution of the observed GRB X-ray luminosity (see Figure 2), which lends support to the hypothesis (Kumar et al. 2008a,b) that the X-ray luminosity is proportional to the accretion rate. We have identified three phases in the evolution of the accretion rate in our simulations, which appear to correspond to Phases 0 (the prompt phase), Phase I, and Phase II in the nomenclature of Zhang et al. (2006). The details of these phases are described to the right. Phase II The steep decline of the accretion rate slows down or stalls after ~ 600 s, which appears to reflect the settling of a fraction of the stellar envelope in the state of near-hydrostatic equilibrium. The inner, rotationally supported thick disk contains ~ 1% of the mass of the unaccreted envelope and extends to ~ 3 × 10^9 cm. The thick disk is surrounded by a much more massive, pressure-supported atmosphere, which acts as a mass supply to the thick disk. The fluid above and below the thick disk is mostly unbound and the simulations thus exhibit a form of a “disk wind.” See Figure 5. Figure 5: The large-scale density distribution (left panel) and meridional Mach number (center panel) at t = 2,000 s in the lowest-resolution simulation. Meridional motions in the pressure-supported atmosphere that contains most of the unaccreted mass are subsonic, indicating that largescaleinfall has ceased. The right panel shows the value of the Bernoulli function at t = 1,000 s in our medium resolution simulation. The material with positive values of the Bernoulli function (red color ) has enough energy to escape from the system. Figure 3: The innermost accretion flow, shortly prior (left panel) and shortly following (right panel) the formation of an accretion shock at t ~ 37 s in our highest resolution run with Rmin = 5 × 10^7 cm. The color scale denotes the fluid density. The black contours show the T = (4, 5, 6, 7)×10^9 K isotemperature contours. The arrows show the meridional component of the fluid velocity. Figure 4: The quantity p/(rho^gamma) at t = 70 s (left panel) and t = 100 s (right panel) in the center of the star, in the highest resolution run. The high entropy fluid tracks the outflow from the disk. The low-entropy fluid accreting through the axial funnel traverses multiple weak standing accretion shocks before it joints the disk or passes the boundary at R = Rmin. The primary, outward propagating accretion shock is visible along the right edge of the left panel. Acknowledgements We would like to thank RameshNarayan and Craig Wheeler for encouraging this research at an early stage. We would also like to thank Stan Woosley and Alex Heger for making their pre-supernova stellar model 16TI available. In addition, we would like thank Rodolfo Barniol Duran and RongfengShen for valuable discussions. The software used in this work was in part developed by the DOE-supported ASC/Alliance Center for Astrophysical Thermonuclear Flashes at the University of Chicago. The authors acknowledge the Texas Advanced Computing Center (TACC) at the University of Texas at Austin for providing high-performance computing resources that have contributed to this research. M. M. acknowledges support from NSF grant AST-0708795. References Kumar, P., Narayan, R., & Johnson, J. L. 2008a, Science, 321, 376 Kumar, P., Narayan, R., & Johnson, J. L. 2008b, MNRAS, 388, 1729 Vaughan, S. et al. 2006, ApJ, 638, 920 Woosley, S. E., & Heger, A. 2006, ApJ, 637, 914 Zhang, B., Fan, Y. Z., Dyks, J., Kobayashi, S., M´esz´aros, P., Burrows, D. N., Nousek, J. A., & Gehrels, N. 2006, ApJ, 642, 354 This work has been submitted for publication to ApJ as Lindner, Milosavljevic, Couch, & Kumar 2009.