Download
1 / 14
140 likes | 308 Views
Education in Chile. Maria-Paz Fernandez. Chile. Population: 17.2 million Government: Democratic Republic Central government GDP Per Capita of $17,200 (US $49,000) Ranked 15/136 countries with most unequal family income distribution (US is 42). Chile. Administrative division :.

E N D
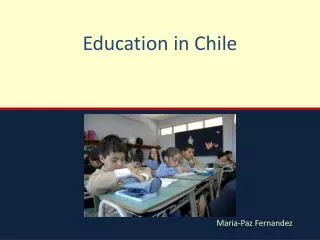
Education in Chile Maria-Paz Fernandez
Chile • Population: • 17.2 million • Government: • Democratic Republic • Central government • GDP Per Capita of $17,200 (US $49,000) • Ranked 15/136 countries with most unequal family income distribution (US is 42)
Chile Administrative division: • 15 Regions • 344 communes in Continental Chile
Chilean Educational System • Three types of schools • Public • Subsidized • Private • 2 standardized tests: • PSU (12th grade), University admissions test. Those who score above 450 points can apply to the best Universities • Simce (2nd, 8th and 10th grades) • Differences between types of schools Source: DEMRE
Protests Against the Education System • Consequences of current educational system • Differences between types of schools • Differences in access to high quality education determined by income • Access to University • Several factors can determine quality of education Source: La Tercera Source: The Clinic
Are there any areas (hotspots) where the government should focus its attention in public Education?
School Coverage • Are there areas where more public schools are needed? • Darkest areas show concentrations of population and schools. • There appears not to be a coverage problem.
Test Scores • 2 standardized tests: • PSU (12th grade) • Simce (2nd, 8thand 10th grades) • Are there any areas where public schools tend to do worse on standardized tests? • There appears to be no concentration.
Teacher Quality • Teachers are evaluated by the government. • Their skills are classified in one of 4 categories: • Outstanding • Competent (minimum) • Basic • Insufficient • Are there any areas where schools tend to have more teachers with lower skills?
Poverty • Poverty as an important factor that can lead to lower students’ performance • Students are measured in 3 priority levels • “Vulnerability” • Are there any areas where schools tend to have more vulnerable students?
Education Index • Parents’ education is important factor. • Are there any areas where people tend to have a lower educational attainment index?
Findings • The Araucania and Los Rios regions are the educational hotspots • They should receive more attention from the government because they have the most “vulnerable” schools
Sources • Brandt, Nicola. (2010). Chile: Climbing on Giants´ Shoulders: Better Schools for all Chilean Children. Organisation for Economic Co-operation and Development (OCDE). • ESRI, www.esri.com • Integrated System of Territorial Information (SIIT), Library of Congress Chile, siit.bcn.cl • National Statistics Institute Chile (INE), www.ine.cl • La Tercera, www.latercera.com • Ministry of Education Chile (Mineduc), www.mineduc.gob.cl • National System of Municipal Information Chile (Sinim), www.sinim.cl/indicadores/busq_serie_var.php • Suryadarma, Daniel, et al. (2006). Improving Student Performance in Public Primary Schools in Developing Countries. Evidence from Indonesia. World Bank Research Paper. • The Clinic, www.theclinic.cl • University of Chile, Department of Education Evaluation, Measurement and Registry (DEMRE), www.demre.cl/estadisticas.htm • University of Chile, Department of Education Evaluation, Measurement and Registry (DEMRE). (2012). Compendio Estadístico Proceso de Admisión Año Académico 2012. Santiago, University of Chile. • World Bank, Data Catalog, data.worldbank.org