Download

1 / 13
130 likes | 219 Views
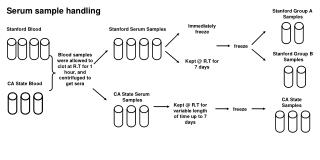
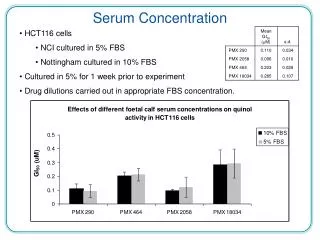
Serum sample handling. Stanford Group A Samples. Immediately freeze. Stanford Blood. Stanford Serum Samples. freeze. Stanford Group B Samples. Blood samples were allowed to clot at R.T for 1 hour, and centrifuged to get sera. Kept @ R.T for 7 days. CA State Blood. CA State Serum

E N D
Serum sample handling Stanford Group A Samples Immediately freeze Stanford Blood Stanford Serum Samples freeze Stanford Group B Samples Blood samples were allowed to clot at R.T for 1 hour, and centrifuged to get sera Kept @ R.T for 7 days CA State Blood CA State Serum Samples CA State Samples Kept @ R.T for variable length of time up to 7 days freeze
30 Total # of feature: 746 20 Density 10 0.0 0.0 0.2 0.4 0.6 0.8 1.0 ANOVA P value
Stanford Group B vs. A CA State vs. Stanford Group A CA State vs. Stanford Group B 10 8 6 Density 4 2 0 0.0 0.2 0.4 0.6 0.8 1.0 0.0 0.2 0.4 0.6 0.8 1.0 0.0 0.2 0.4 0.6 0.8 1.0 Tukey HSD P value between sub groups
Distribution of DCV of each feature Distribution of CV of each feature 4.0 2.0 3.0 1.0 2.0 0.0 1.0 -1.0 0.0 -2.0 CA State – Stanford Group A CA State – Stanford Group B Stanford Group A Stanford Group B Stanford Group B – A CA State
MAX Stanford Group A Stanford Group B Molecular Weight CA State MIN
Stanford Group A Stanford Group B Stanford Group A Stanford Group B CA State CA State 600 500 400 300 200 100 ALB – MW 66224 APOC1 – MW 6629 000 600 CO3 – MW 8125 TF – MW 78284 500 400 300 200 100 000
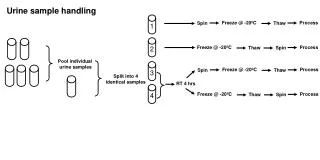
Urine sample handling 5 X Day 1 Day 2 Day 3 Day 4 Day 5 1 Process 2 R.T. Process Pool 5 individual urine samples Split into 6 identical samples 3 R.T. Process 4 R.T. Process 5 R.T. Process 6 Receive FEDEX Transit Process
Total # of feature: 100737 1.5 1.0 Density 0.5 0.0 0.0 0.2 0.4 0.6 0.8 1.0 ANOVA P value
12 10 8 6 4 2 0 0.0 0.0 0.0 0.0 0.2 0.2 0.2 0.2 0.4 0.4 0.4 0.4 0.6 0.6 0.6 0.6 0.8 0.8 0.8 0.8 1.0 1.0 1.0 1.0 Day 2 vs. Day 1 Day 3 vs. Day 1 Day 4 vs. Day 1 Day 5 vs. Day 1 FEDEX vs. Day 1 Density 0.0 0.2 0.4 0.6 0.8 1.0 Tukey HSD P value between sub groups
Distribution of DCV of each feature Distribution of CV of each feature 2.0 2.0 1.5 1.0 1.0 0.0 0.5 -1.0 0.0 -2.0 Day 1 Day 2 Day 3 Day 4 Day 5 FEDEX Day 2 - Day 1 Day 3 - Day 1 Day 4 - Day 1 Day 5 - Day 1 FEDEX - Day 1
Day 1 Day 2 Day 3 Day 4 Day 5 FEDEX
Case study of THP peptides • THP 982.59 VLNLGPITR • THP 1047.48 SGSVIDQSRV • THP 1211.66 DQSRVLNLGPI • THP 1225.69 SRVLNLGPITR • THP 1324.76 IDQSRVLNLGPI • THP 1423.83 VIDQSRVLNLGPI • THP 1468.82 DQSRVLNLGPITR • THP 1510.87 SVIDQSRVLNLGPI • THP 1567.91 GSVIDQSRVLNLGPI • THP 1581.91 IDQSRVLNLGPITR • THP 1654.91 SGSVIDQSRVLNLGPI • THP 1680.98 VIDQSRVLNLGPITR • THP 1755.96 SGSVIDQSRVLNLGPIT • THP 1768.01 SVIDQSRVLNLGPITR • THP 1912.07 SGSVIDQSRVLNLGPITR • THP 2040.16 SGSVIDQSRVLNLGPITRK
5. 9. 13. 1. 6. 10. 14. 2. 7. 11. 15. 3. 8. 12. 16. 4.