Logic Models and SMART
Logic Models and SMART. Logic Model. What is a L ogic Model ? Information system that enables an analyst or other non-expert to understand a program’s components and establish a measurable result Logic Models help identify what is important to measure

Logic Models and SMART
E N D
Presentation Transcript
Logic Models and SMART GOMB DRAFT
Logic Model • What is a Logic Model? • Information system that enables an analyst or other non-expert to understand a program’s components and establish a measurable result • Logic Models help identify what is important to measure • Logic Models help the analyst visualize the flow of the program from the start to the end result GOMB DRAFT
Logic Models Clarify: • What goes into a program • Who its customers are • What services it provides • What immediate products or outputs it produces • What outcomes it is supposed to generate GOMB DRAFT
Key definitions for Logic Models and Performance Metrics • Inputs: The time, money, personnel and resources that are necessary in order to allow a program to function to its full potential • Activity Measure: Information or data used to quantify the delivery of state services. • Example: The number of people served or the number of cases closed GOMB DRAFT
Definitions continued • Outputs: The results of program activity • Answers questions such as Have test scores improved? or Have road traffic accidents decreased? • Outcomes: Reliable and valid translation of activity/output measures that allows observers to see if a program has met its goal • Answers questions such Are the citizens of this state healthier than last year? or Are the citizens of this state safer than last year? GOMB DRAFT
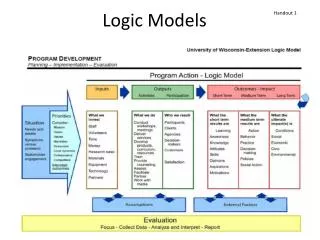
Sample state-level logic model: Reducing and preventing youth tobacco use Outcomes / Impact Activities Reach Short-term Medium-term Long-term Inputs Increased awareness of need to eliminate youth access to tobacco products, including tobacco industry tactics, laws, noncompliance • Promote community involvement in restricting tobacco access to youth • Establish baseline of current practices • Inform/educate • Eliminate self-service • Facilitate active enforcement of laws Increased compliance and enforcement of laws and policies Decreased access to tobacco for minors Community Parents, Caretakers Law enforcement Retailer Health Department Coalition Members Decreased supply to minors Increased commitment to eliminate access/sources Funding Social norms less supportive of youth tobacco use Increased knowledge and skills in participating in policy change Increased # of youth actively engaged in policy change Community org, Businesses Policy makers Adults Youth serving org Youth • Partners • Local • Regional • State • Facilitate youth involvement in policy change • Recruit youth • Involve youth/adults • Educate Increased commitment by youth and adults for youth to participate in policy change Increased adoption of policy changes that involve youth in the change process • Promote school and community based prevention programs and policies • Establish baseline of existing resources • Educate • Assist with planning and implementing programs/services Research and best practices Delayed average age at first use; reduced initiation Increased knowledge about tobacco dependence; benefits and options for youth prevention (e.g, CDC guidelines, school-family initiatives) Schools Community Families Youth serving org Youth Increased # of effective prevention programs or policies adopted Reduced morbidity and mortality Increased # of youth participating in prevention programs See Treating Tobacco Addiction Youth Logic Model Promote youth cessation services and policies Increased commitment to adopt effective programs/policies for youth prevention
Collecting Data • Agencies will report metric data on a quarterly basis • Agencies will enter the data into a web-based system administered by GOMB GOMB DRAFT
Evaluating Data • The data collected will be evaluated against the goals and sub-goals using the SMART system STATEFEDERAL Strategic Program Management Assessment Accountability Rating Reporting Tool Tool GOMB DRAFT
Evaluating Data • SMART is a questionnaire completed by GOMB analysts • Analysts will utilize the data collected during the course of the year to answer the yes/no questions related to the program • The questions are weighted GOMB DRAFT
Evaluating Data • Once the scores are tallied, the program is given a rating in a range from not effective to effective GOMB DRAFT
Utilizing Data To Allocate Resources • SMART evaluations, and other policy considerations, will help determine the resources allocated in the next fiscal year GOMB DRAFT