Download
1 / 40
400 likes | 415 Views
Test your knowledge of geographical features and concepts with these visuals. Identify maps, landscapes, ethnicities, and more to enhance your geographic understanding.

E N D
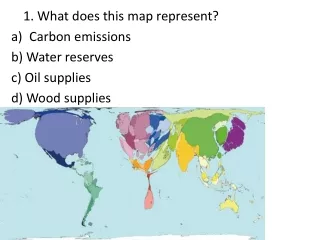
1. What does this map represent? • Carbon emissions b) Water reserves c) Oil supplies d) Wood supplies
2. In which country can you see this landscape? • Equatorial Guinea • Iran • Norway • Hungary
3. Where can you find this type of volcano? • Italy • Hawaii • Iceland • Japan
4. What does this map represent? • Coffee production • Cocoa production • Vanilla production • Bananas production
5. Which country has the youngest population? a) Nigeria b) Senegal c) Sierra Leone d) Rwanda
6. Which ethnicity does this man represent? a) Berber b) Tuareg c) Mendi d) Sara
7.Which type of erosion made this landform? • Wind erosion • Karst erosion • Fluvial erosion • Denudation
8. What does this map represent? • Forest loss • National income • Bananas production • Total population
9. Where the most refugees originated from, according to the UN? • Bangladesh • Pakistan • India • Myanmar
10. Which of the following toponyms best belongs in a formal culture region defined by common traits of Catholicizmand Spanish language? • Dar es Salam b) San Jose c) Fauske d) Saint Paul
11. What does this map represent? • Risks of floods • Risks of earthquakes • Risks of droughts • Risks of hail
12. What does this map represent? a) Oil production b) Copper production c) Coal production d) Lead production
13. Which country was most affected by tsunami in 2004(with most victims)? • Maldives • Sri Lanka • Indonesia • Bangladesh
14. Which mine is represented below? • Coal mine • Copper mine • Lead mine • Gold mine
15. The heaviest hail storm in history happened in: • India • Maldives • Serbia • Hungary
16. The orange colour on this graphics shows car production in which country? • USA • Italy c) Ireland d) Sweden
17. According to the UN, which country has the oldest population? • Germany • Serbia • Japan • South Korea
18. The prohibition that forbids Hindus from slaughtering or consuming beef is an example of: a) a Sharia law b) a religious proscription c) an ethnic conflict d) an animistic tradition
19. Which of the following Amerindian languages is spoken on the Yucatan peninsula of Mexico? • Comanchan • Mayan • Cherokee • Lakota
20. As many as 80 percent of all Muslims belong to the following denomination of Islam: • Dravidian • Shia • Sunni • Meccan
21. This picture represents: • A. Medina • B. Mecca • C. Riyadh • D. Jerusalem
22. Where was the picture taken? • A. Mali • B. Algires • C. Niger • D. Senegal
23. In global cities, frequent displacement of minority populations with low incomes is often caused by the process of: • A. social reproduction • B. urban blight • C. gentrification • D. rent control
24. Find the wrong term: • A. Bidonvilles • B. Barrios • C. Favelas • D. Maquiladoras
25. To which of these cities does the climate graph correspond? • A. San Diego • B. Vancouver • C. Marseille • D. Madrid
26. What is the correct sequence of the atmospheric layers from bottom-to-top ? • A. Mesophere, Troposphere, Thermosphere, Stratosphere • B. Troposphere, Stratosphere, Mesophere, Thermosphere • C. Stratosphere, Troposphere, Mesophere, Thermosphere • D. Thermosphere, Troposphere, Stratosphere, Mesophere
27. This schematic illustration of the major upper-troposphere features represents: • Monsoon in the winter • Monsoon in the summer • Typhoon • Tronado
28. Which of the following groups of American cities is part of the Rust Belt? • A. Detroit, Buffalo, and Cleveland • B. San Jose, Palo Alto, and Cupertino • C. St. Louis, Little Rock, and Oklahoma City • D. Atlanta, Augusta, and Knoxville
29. This schematic illustration is representation of: • A. Modernization theory • B. Central-place theory • C. Dependence theory • D. Grass-roots approach
30. Brandt line is dividing countries of the world in two groups: • A. Members and non-members of WTO • B. Countries of global North and global South • C. Countries with high and low life expectancy • D. Members and non-members of OECD
31. What does this map represent? • A. Industrial regions of Europe • B. Coal mining areas of Europe • C. Cobalt mining areas of Europe • D. Bauxite mining areas of Europe
32. Which classical model of urban structure does this figure represent? • A. Concentric zone model • B. Sector model • C. Multiple nuclei model • D. Garden city
33. This map shows the distribution of: • A. Principal wheat-growing areas • B. Principal corn-growing areas • C. Principal rice-growing areas • D. Principal apple-growing areas
34. The top ten producers of this product are shown in the table. What is the product? • A. Alumina • B. Raw steel • C. Gold • D. Silver
35. Which of the following types of agriculture is used most widely throughout the world? • A. Commercial farming • B. Slash-and-burn • C. Plantation • D. Shifting cultivation
36. Where was the picture taken? • A. Bruges • B. Amsterdam • C. Antwerp • D. Utrecht
37. This photograph was taken in a capital city located near 116 degrees East. The country to which this capital belongs to is well known for its low population density. Which two cities are located at the same longitude as the city in the photograph? • A. Ho chi minh city and Jakarta • B. Phnom Penh and Kuala Lumpur • C. Vientiane and Singapore • B. Manila and Canberra
38. Which of the following is true regarding least developed countries (LDC) and mostdeveloped countries (MDC)? • A. LDC have lower infant mortality rates than MDC. • B. LDC have higher standards of living than MDC. • C. MDC have lower illiteracy rates than LDC. • D. Economies of MDC have more reliance on agricultural production than LDC.
39. Which regions have the fewest freshwater resources per capita? • A. Latin America and the Caribbean • B. Europe and Central Asia • C. Middle East and North Africa • D. Sub-Saharan Africa and South Asia
40. Which of the following countries has the least arable land per capita? • A. Canada • B. Australia • C. Kazakhstan • D. China