Download
1 / 43
430 likes | 603 Views
Network Monitoring and Management. Introduction to Networking Monitoring and Management. Network Management Details. We Monitor Systems & Services Available, reachable Resource utilisation Expansion planning, maintain availability Performance Round-trip-time, throughput

E N D
Network Monitoring and Management Introduction to Networking Monitoring and Management
Network Management Details We Monitor • Systems & Services • Available, reachable • Resource utilisation • Expansion planning, maintain availability • Performance • Round-trip-time, throughput • Changes and configurations • Documentation, revision control, logging • Requests and issues • Ticketing system
The big picture Notifications - Monitoring - Data collection - Accounting Ticket - Change control & monitoring - NOC Tools - Ticket system - Capacity planning - Availability (SLAs) - Trends - Detect problems Ticket Ticket Ticket - Improvements - Upgrades Ticket - User complaints - Requests - Fix problems
The “Big Three”? Availability • Nagios Services, servers/routers/switches. Alerting, availability reports Utilisation • Cacti Total traffic, port usage, CPU, RAM, Disk, processes Reliability • Smokeping Packet loss, RTT/latency, service response time Functional overlap exists between these programs!
Main components of these tools • Data collection • Data storage • Data visualisation • Configuration • e.g. what to monitor and how • Additional functionality • e.g. alerting via E-mail
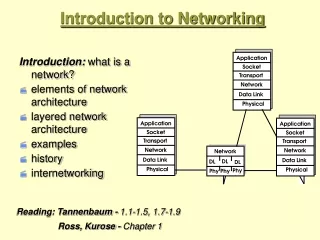
Data collection: SNMP • SNMP – Simple Network Management Protocol • Industry standard, hundreds of tools exist to exploit it • Present on any decent network equipment • There are SNMP agents for Unix and Windows servers • Query – response based: GET / SET • GET is mostly used for monitoring • Each piece of information is identified by a numeric Object Identifier or ”OID” • Forms a unique key within any particular device • A collection of related OIDs is called a MIB (Management Information Base)
The MIB Tree root iso(1) ccitt(0) joint-iso-ccitt(3) org(3) dod(6) 1.3.6.1 internet(1) directory(1) mgmt(2) experimental(3) private(4) mib-2(1) enterprises(1) host(25) system(1) snmp(11) cisco(9) interfaces(2) hrDevice hrStorage ip(4) hrSystem
The MIB Tree root iso(1) ccitt(0) joint-iso-ccitt(3) org(3) ciscoMgmt(9) dod(6) ciscoEnvMonMIB(13) 1.3.6.1 ciscoEnvMonObjects(1) internet(1) ciscoEnvMonTemperatureStatusTable(3) directory(1) mgmt(2) experimental(3) private(4) ciscoEnvMonTemperatureStatusEntry(1) mib-2(1) enterprises(1) ciscoEnvMonTemperatureStatusValue(3) cisco(9) system(1) snmp(11) interfaces(2) ip(4) ...
OIDs and MIBs • Navigate tree downwards • OIDs separated by '.' • 1.3.6.1.2.1.1.5 • Text labels • .iso.org.dod.internet.mgmt.mib-2.system.sysName • Usually the end label is unique by itself • .1.3.6.1.2.1.1.5 => sysName • MIB files resolve labels to OIDs and vice versa • only OIDs are actually sent over the wire
SNMP transport • UDP protocol, port 161 • Different versions • V1 (1988) – RFC1155, RFC1156, RFC1157 • Original specification • v2 – RFC1901 ... RFC1908 + RFC2578 • Extends v1, new data types, better retrieval methods (GETBULK) • Used is version v2c (without security model) • v3 – RFC3411 ... RFC3418 (w/security) • Typically we use SNMPv2 (v2c)
Testing SNMP by hand • Useful for debugging • snmpstatus -c public -v2c 10.10.0.254 • snmpget –c public -v2c 10.10.0.254 sysUptime.0 • snmpwalk -c public -v2c 10.10.0.254 ifDescr • (Note: SNMP won’t respond if community string is wrong)
Storage and visualisation: rrdtool • Has become the de-facto method of storing time-sequence data • Data written in a “round-robin” file • rrd files are of fixed size • As newer data is entered, older data is consolidated to make space • so older data has lower resolution • Hugely flexible API for generating graphs
1. Nagios • Periodically tests hosts and services for availability • Sends alerts and/or triggers event handlers • Logs history, generates SLA reports
Nagios architecture • Data collection: “Nagios Plugins” • Small, self-contained applications which make a single connection to test a service then quit • Return OK, Warning, Critical or Unknown • Many plugins supplied, even more available • Easy to write your own • Data storage: plain text files • Data visualisation: CGI web interface • Configuration: plain text files
Pre-installed plugins in Ubuntu /usr/lib/nagios/plugins /etc/nagios-plugins/config
Nagios core state machine • Nagios schedules the checks to run evenly over the monitoring interval (e.g. 5 minutes) • When a plugin returns Warning or Critical, Nagios enters a “soft” error state • After a certain number of re-checks, enters a “hard” error state. At this point an alert is sent • Repeated state changes enter “flapping” state which suppresses further notifications • Designed to limit the day-to-day noise
Hosts and services • Generally we are interested in checking services • Services run on hosts • Nagios checks both hosts and services • If a host fails, it’s smart enough to send you one notification for the host, rather than separate notifications for each service on that host
The concept of “parents” • Hosts can have parents: • The parent of a PC connected to a switch would be the switch. • Allows us to specify the dependencies between devices. • Avoids sending alarms when parent does not respond. • A node can have multiple parents (dual homed).
2. Cacti • A tool to monitor, store and presentnetwork and system/server statistics • Designed around RRDTool with a specialemphasis on the graphical interface • Almost all of Cacti's functionality can beconfigured via the Web. • Acts as portal: let customers see their own graphs
Cacti architecture Cacti is written as a group of PHP scripts. The key script is “poller.php”, which runs every 5 minutes (by default). Data can be collected using SNMP or via PHP scripts. Cacti uses RRDtool to store data on disk and create graphs for each device. You can configure them from within the Cacti web interface. User configuration data is stored in a MySQL database Configuration of what types of data to collect and how to graph them is stored in template files (XML) Cacti Plugin Architecture allows Cacti functionality to be extended
Adding graphs to Cacti Add a Device with the right Data sources Create Graphs for that device Add the graphs to Graph Trees Simple when you’ve done it a few times Tedious if you have lots of devices to add
3. Smokeping • Based on RRDTool (the same author) • Measures ICMP round-trip time • Measures service response time, e.g. HTTP request, DNS request • Can run slave servers at different points around your network (or around the world)
How to Read Smokeping Graphs How to Read Smokeping Graphs • Smokeping sends multiples tests (pings), makes note of RTT, orders these and selects the median. • The different values of RTT are shown graphically as lighter and darker shades of grey (the “smoke”). This conveys the idea of variable round trip times or jitter. • The number of lost packets (if any) changes the color of the horizontal line across the graph.
MultiHost Graphing Combine multiple data sources into one graph with the same Y-axis scalehttp://oss.oetiker.ch/smokeping/doc/smokeping_examples.en.html Sample configuration +++MultihostRouters menu = MutihostRouters title = Combined Router Results host = /Local/Routers/gw-rtr /Local/Routers/rtr1 /Local/Routers/rtr2
Corefunctionalityincludes: • Discovery of network interfaces via SNMP • Layer 2 topologydiscovery and graphicsusing: • CDP/LLDP • SpanningTreeprotocol • Switchesforwardingtables • Routerpoint-to-pointsubnets • VLANs • IPv4 and IPv6 addressmanagement (IPAM) • Addressspacevisualization • DNS and DHCP configurationmanagment • IP and Mac addresscorrelationfrom ARP tables
Functionality cont. • Cable plants (sites, fibre, copper, closes, circuits) • Contacts (departments, providers, vendors, etc.) • Export of data for various tools (Nagios, Sysmon, RANCID, Cacti, etc.) • For example, automate Cacti configuration • User access-level: admin, operator, user • Reports • Ability to draw pretty pictures of your network.
Topology example Netdot can draw the topology of a network or a segment of a network dynamically.
IP Space: Addresses and Blocks • Hierarchical (drill-down) and graphical representation • Support for IPv4 and IPv6 • Classification in: • Block • Container • Subnet • Reserved • Address • Static • Dynamic • Reserved
Netflow • Find out who is using your bandwidth and for what • You need a router which can export Netflow data; or a switch with a mirror port (and a PC to generate the flow records) • Tools like nfsen can collect, store, and help you visualise the data
Other essential tools • Rancid: archive your router and switch configurations • Syslogd, swatch/tenshi: centralise your logs, alert on unusual messages • RT: ticketing system • A wiki: documentation which you keep up to date continually
Choosing equipment • Keep management in mind when selecting equipment – e.g. it must have SNMP • Configure the management features • Enable SNMP • Enable SSH, disable Telnet • Synchronise time using NTP • Set strong passwords • Try to get rid of unmanaged switches - or at least keep them at the very edge of your network (and only one layer deep)