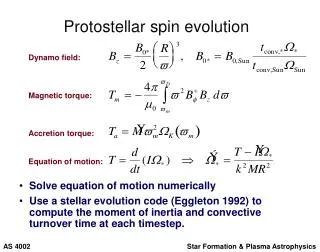
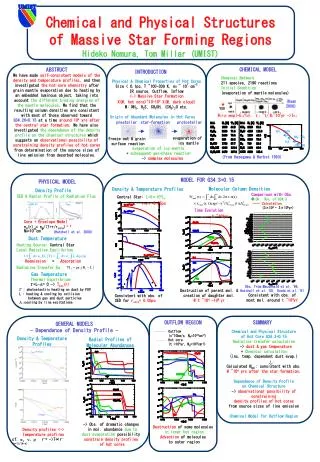
Download
1 / 2
20 likes | 128 Views
Chemical and evolutionary diversity in a massive protostellar cluster. 2”.

E N D
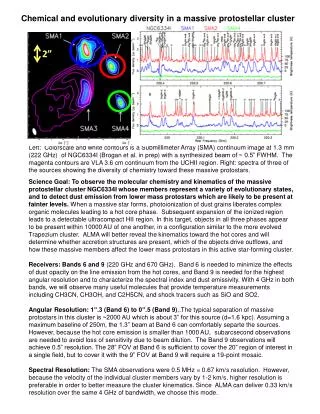
Chemical and evolutionary diversity in a massive protostellar cluster 2” Left: Colorscale and white contours is a SubmillimeterArray (SMA) continuum image at 1.3 mm (222 GHz) of NGC6334I (Brogan et al. in prep) with a synthesized beam of ~ 0.5” FWHM. The magenta contours are VLA 3.6 cm continuum from the UCHII region. Right: spectra of three of the sources showing the diversity of chemistry toward these massive protostars. Science Goal: To observe the molecular chemistry and kinematics of the massive protostellar cluster NGC6334I whose members represent a variety of evolutionary states, and to detect dust emission from lower mass protostars which are likely to be present at fainter levels.When a massive star forms, photoionization of dust grains liberates complex organic molecules leading to a hot core phase. Subsequent expansion of the ionized region leads to a detectable ultracompact HII region. In this target, objects in all three phases appear to be present within 10000 AU of one another, in a configuration similar to the more evolved Trapezium cluster. ALMA will better reveal the kinematics toward the hot cores and will determine whether accretion structures are present, which of the objects drive outflows, and how these massive members affect the lower mass protostars in this active star-forming cluster. Receivers: Bands 6 and 9 (220 GHz and 670 GHz). Band 6 is needed to minimize the effects of dust opacity on the line emission from the hot cores, and Band 9 is needed for the highest angular resolution and to characterize the spectral index and dust emissivity. With 4 GHz in both bands, we will observe many useful molecules that provide temperature measurements including CH3CN, CH3OH, and C2H5CN, and shock tracers such as SiO and SO2. Angular Resolution: 1”.3 (Band 6) to 0”.5 (Band 9),.The typical separation of massive protostars in this cluster is ~2000 AU which is about 3” for this source (d=1.6 kpc).Assuming a maximum baseline of 250m, the 1.3” beam at Band 6 can comfortably separte the sources. However, because the hot core emission issmaller than 1000 AU,subarcsecond observations are needed to avoid loss of sensitivity due to beam dilution. The Band 9 observations will achieve 0.5” resolution. The 28” FOV at Band 6 is sufficient to cover the 20” region of interest in a single field, but to cover it with the 9” FOV at Band 9 will require a 19-point mosaic. Spectral Resolution:The SMA observations were 0.5 MHz = 0.67 km/s resolution. However, because the velocity of the individual cluster members vary by 1-2 km/s, higher resolution is preferable in order to better measure the cluster kinematics. Since ALMA can deliver 0.33 km/s resolution over the same 4 GHz of bandwidth, we choose this mode.
Sensitivity and Observing time: The SMA spectra are 40 mJy/beam rms. Using the ALMA integration time calculator with 16 12 m antenna, dual polarization and 0.25 MHz channels, these point source sensitivities can be achieved in only 4 minutes at Band 6 and 0.8 hours per field at Band 9. To cover 19 fields at Nyquist spacing, we need 0.8*sqrt(19) = 3.5 hours in Band 9. To match the uv-coverage of Band 9 (and the SMA observations), we actually need 1.5 hours at Band 6. Because both spectra will contain line-free areas in which to model the continuum emission, the continuum sensitivity will correspond to a substantial fraction of the total bandwidth. The rms we can achieve will be as low as 0.07 mJyrms at Band 6, and 0.5 mJyrms in Band 9 These relative sensitivities provide a good match to the typical spectral index of dust emission and will enable detections of the low-mass protostars associated with the cluster. In the future: As ALMA’s maximum baseline length increases, the hot cores in this example can be better resolved at all wavelengths, and with matched angular resolution. The science case presented here can be expanded to search for binary protostars and to resolve their individual protostellar disks within each hot core. Band 3 observations at the same angular resolution of 0.4” for Band 9 would allow us to investigate the small-scale free-free emission and presence of hypercompact HII regions. However, these observations will require a maximum baseline of 1.5 km. Place holder for real OT screen capture.