Explaining the Database
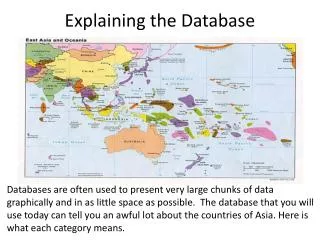
Explaining the Database. Databases are often used to present very large chunks of data graphically and in as little space as possible. The database that you will use today can tell you an awful lot about the countries of Asia. Here is what each category means. Database Definitions.

Explaining the Database
E N D
Presentation Transcript
Explaining the Database Databases are often used to present very large chunks of data graphically and in as little space as possible. The database that you will use today can tell you an awful lot about the countries of Asia. Here is what each category means.
Database Definitions • Population – How many people live in the country • Population growth % - Average exponential rate of growth of the population during a year. Positive numbers indicate a growing population while negative numbers show population decreasing. • Population doubling time – number of years it will take for the population to double • Life Expectancy – How long will the average person live • Literacy % - percent of people who can read and write • GDP per capita – this is the value of all final goods and services produced within a nation in a given year divided by the average population. The higher the number the better the economy.
Database Definitions • Industry – the percent of the GDP that is made up of manufacturing • Agriculture – the percent of the GDP that is made up of farming • Services – the percent of the GDP that is made up of the service industry • Unemployment Rate % - Percent of the population that is unemployed • Infant Mortality – the number of infants who die within the first five years. The lower this number is, the better. • Density – Average number of people that live in each square kilometer. A high number means crowding.