Download
1 / 16
160 likes | 351 Views
Change in Census Data vs. Change in Bus Routes. Starke Gardner. Why is it so important?. So this doesn’t happen Environmentally and Economically sustainable People like to ride the bus Why did we make this change? Was it timely? I was just curious. Getting the data…. What I needed:

E N D
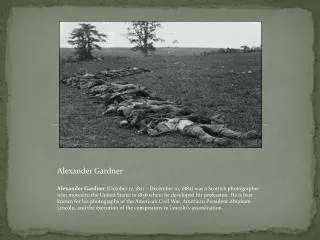
Change in Census Data vs. Change in Bus Routes Starke Gardner
Why is it so important? • So this doesn’t happen • Environmentally and Economically sustainable • People like to ride the bus • Why did we make this change? • Was it timely? • I was just curious
Getting the data… What I needed: • Buncombe county boundary files for 2000 and 2010, • Census data for 2000 and 2010 • Route 29 and Route 170 Where I got it: • American Fact Finder 2(census.gov) • Data.gov • Created it using Google Maps and Google Earth
Taming the data… Headaches ensue… The problem: The census data formatted so it wasn’t useful to anyone. It was ridiculous… The solution: I had to do fancy spreadsheet formulas to parse out a GEOID so I could then merge it with the blockgroup shapefile. This took hours of work…
Fun with google • Google maps is an easy tool to create polylines • Trouble with ArcMap converting to shapefile • Used an online tool: http://www.zonums.com/online/kml2shp.php maps.google.com/blahblah&output=kml
Game Plan • Buffer each route • Overlay each route over 2000 and 2010 census blockgroup data • Figure out how many people live in the buffer • Population based on proportional area of buffer against whole block group
What now? • What I need to do: • Buffer_Area/BG_Area*Population • How to get there • Import the blockgroups into a geodatabase so I get the Shape_Area field • Add a field and copy Shape_Area • Intersect buffered bus route • Add another field and calculate it using that formula • Dissolve the intersected buffer and SUM the field we calculated in the last step.
Results Route 170… • 2000 census data covered: 4963.649342 • 2010 census data covers: 5101.924591 Route 29… • 2000 census data covered: 3533.571705 • 2010 census data would cover: 3533.719862
Why didn’t we do it sooner? • Doesn’t include Wal-Mart or Biltmore • Longer distance • Cost money to research • More accurate model
Problems and suggestions Problems • Data formatting • Files not in geodatabase don’t play as nicely • General issues with ArcMap being obnoxious Suggestions • Geodatabases! • Consider bus stops • Consider attractions
Credits and stuff Things I used: • Google Maps • Google Earth • Census.gov • Data.gov • zonums.com/online/kml2shp.php • My brain