O 1
80 likes | 280 Views
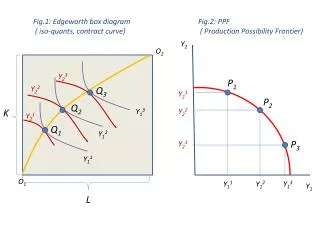
Fig.1: Edgeworth box diagram ( iso-quants, contract curve). Fig.2: PPF ( Production Possibility Frontier). Y 2. O 2. Y 2 3. P 1. Y 2 2. Q 3. Y 2 1. P 2. Q 2. K. Y 1 3. Y 2 2. Y 2 1. Q 1. Y 1 2. P 3. Y 2 3. Y 1 1. O 1. Y 1 1. Y 1 2. Y 1 3. Y 1. L. Y 2.

O 1
E N D
Presentation Transcript
Fig.1: Edgeworth box diagram ( iso-quants, contract curve) Fig.2: PPF ( Production Possibility Frontier) Y2 O2 Y23 P1 Y22 Q3 Y21 P2 Q2 K Y13 Y22 Y21 Q1 Y12 P3 Y23 Y11 O1 Y11 Y12 Y13 Y1 L
Y2 Fig.3 : Supply of goods (財の供給) Y1 and Y2 are determined at the tangency point of line with slope of p and PPF P Y2* p Y1* Y1 0
Fig.4: Demand for factors (生産要素市場の均衡) once p is given, then w and r are determined Ls O2 K2d Y2* Q Ks Y12 Y1* K1d w*/r* O1 L1d L2d
Fig.5 : Demand for goods (財の需要) Edgeworth Box Diagram for Consumption when p=p+, excess demand for Y1 and excess supply of Y2. hence, p will rise and tangency point P+ will move to the south and east, like to point P Y2 A P+ Y2+ a (r+K2+w+L2) P P+ c (r+K1+w+L1) Y1+ Y1 0 b
Fig.6 : Equilibrium in Goods Market (財市場の均衡) For the common p*, demand for good 1 equals to the supply of good 1, and demand for good 2 equals to the supply of good 2. Y2 a Y22d P Y2S Y22d Y21d P* P* Y1S Y1 0 Y11d
Y2 Fig.7 : Equilibrium in Goods Market for a case of single individual rK+wL P Y2d=Y2s P* Y1 0 Y1d=Y1S
Y2 Fig.8 : Equilibrium (monopoly) (first industry is monopolized, while the second industry is competitive.) M C Uc Pm Um mr Y1 0
Fig.9: Rybczinski Theorem (Graphical exposition) O2 O2’ Y1* Y2* Q Q’ w*/r* O1 ⊿ L