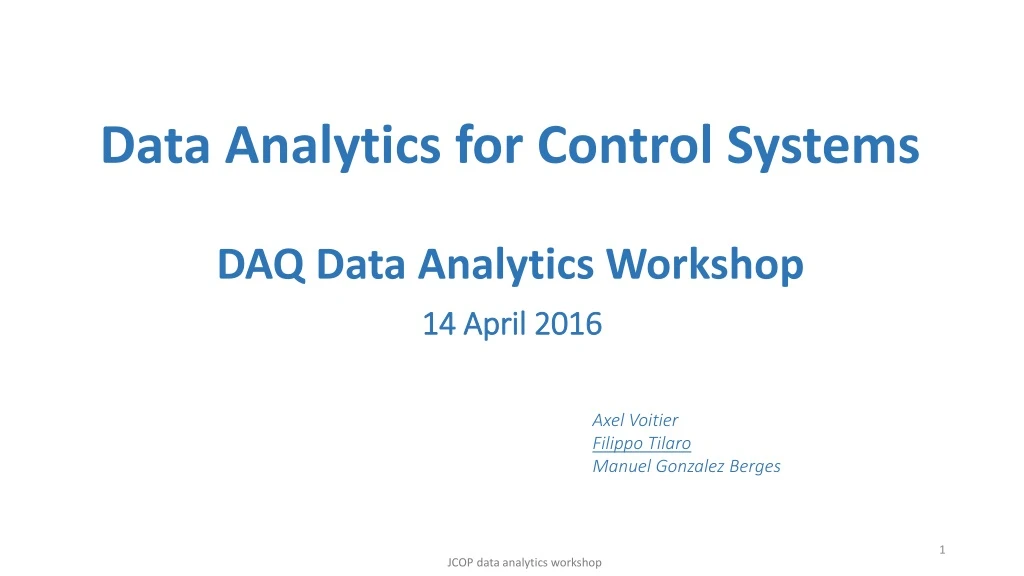

Data Analytics for Control Systems DAQ Data Analytics Workshop
E N D
Presentation Transcript
Data Analytics for Control SystemsDAQ Data Analytics Workshop 14 April 2016 Axel Voitier Filippo Tilaro Manuel GonzalezBerges JCOP data analytics workshop
Our vision of the analysis framework Scalable and fault-tolerant !!! Data Analysis Framework Data Processing Modules FFT Neural Network (R) Analysis memory and configuration MOON (Monitoring) Supervisionlayer Machine Learning CEP (Java) Expert Visualisation Patterns (LabView) (WatchCAT) TN DIM/CMW OPC Processlayer Data collection & feedback PLCs High Voltage Historical Data Fieldbus Field layer Sensors & Actuators DAQ data analytics workshop
Main expected features • Integration with CERN control system • Scalability • Scale the computation load across several hosts (OpenStack VMs) • Distributed storage for temporary results • Merging events and numerical data analysis • Predictive trending • Temporal reasoning (CEP) • Statistical Analysis • Possibility to prototype additional plug-ins and algorithms • Agree on a general API for new algorithm definition and integration • Integration with ‘R’ • Data analysis flow definition in building blocks • Reporting • Graphical visualization of huge list of signals/results • Interface to provide feedback to external systems (i.e.: WinCC OA) • Conversion into a Service • On-line mode for continuous control system monitoring over custom time-windows • Support for historical analysis • Data management • Different sampling rates / gap • Custom data model (i.e.: temperature in K/C) • Custom data access (i.e.: vector vs sequence) DAQ data analytics workshop
CERN control system use-cases Based on real examples DAQ data analytics workshop
Use-cases classification • Online monitoring • Continuous service to analyse the system status and inform operators in case of fault detection • Fault diagnosis • “Forensics” analysis of system faults that have already happened in the past. In some cases root-cause analysis • Engineering design • Analysis of historical data to draw conclusions about system behaviours which could be helpful to improve / optimize the system under analysis DAQ data analytics workshop
Online monitoring Oscillation analysis in cryogenics valves (CRYO, CV) Online analysis of control alarms (MOON) Expert system on monitoring events (CMS) LHC dashboard (CRYO) DAQ data analytics workshop
Oscillation analysis for cryogenics valves • Goal: detect whenever a signal is oscillating in any anomalous way. Impact on: • Control system stability • Increased communication load • Maintenance (use of actuators) • Safety • Performances (Physic time) DAQ data analytics workshop
Oscillation analysis flow On-line analysis: • > 3000 sensors • Continuous analysis • Frequency: 24h DAQ data analytics workshop
Oscillation detection Ex#1 DAQ data analytics workshop
Oscillation detection Ex#2 DAQ data analytics workshop
Online analysis of control alarms • Alarms analysis to detect anomalies or abnormal behaviors for thousands of devices • Parallelization using the CERN OpenStack cluster • Threshold learning algorithm and outliers detection techniques: • Graphical visualization of the anomalies/outliers Web Reporting CERN cloud computing Data Processing MOON: control system infrastructure monitoring Anomaly detection DAQ data analytics workshop
CMS CSC Expert System • (Evaldas Juska ) Complex Event Processing (CEP) Time Alerts DCS Alert Low Current Actions Front-end FPGA not configured Rate Update Logging DAQ New Run Error GUI New Run DQM Low occupancy System Component Knowledge Base DAQ data analytics workshop
CMS CSC Expert System Example • (Evaldas Juska ) HV trip recovery and channel management (10000 channels) DCS VSet = 3400V Disabled Decrease voltage “Weak Channel” Disable Disabled Channel Trip Trip Trip Trip Trip Trip Trip Trip Time 1 hour sliding time window 1 hour sliding time window • Number of HV trips decreased dramatically in 1 month of operation • Minimal loss in efficiency • Only small fraction of channels were labeled “weak” or disabled 600 Number of HV trips per month DAQ data analytics workshop
Control data visualization • LHC Dashboard (Brice Copy) Features: • Faster data extraction • Database query protection mechanism • Data distribution • User friendly navigation • Easy to access • Multiple sources • Multiple output formats (Charts, Table, Text) • Similar to the Atlas DDV (DCS Data Viewer) DAQ data analytics workshop
Fault diagnosis (off-line) Root cause analysis for control alarms avalanches (GAS system) DAQ data analytics workshop
An example: • Gas control system @CERN 9 Apps • 28 gas systems deployed around LHC • 4 Data Server, 51 PLCs (29 for process control, 22 for flow-cells handling) • Essential for particle detection • Reliability and stability are critical • Any variation in the gas composition can affect the accuracy of the acquired data • ~18 000 physical sensors / actuators 6 Apps 7 Apps 6 Apps DAQ data analytics workshop
Alarm flooding problem Domino effect Fault in the distribution system Alarms flooding • Diagnosing a fault is complex: it may take weeks! • Alarms flooding: a single fault can generate up to a thousand of events • Number of different sequences: ~6x10297 from: n!/(n-k)! , n=max seq. length, k=n/10 • A single fault can stop the whole control process • The 1st alarm is not necessarily the most relevant for the diagnosis • Alarm generation depends on the system status DAQ data analytics workshop
Events stream analysis Analyze Learn Diagnose Data Identify and detect fault / abnormal pattern for Diagnosis and Prognostics based on domain knowledge Provide experts with Root-cause and Gap Analysis using Rules and Patterns Mining Forecasts, Trends and Early-Warnings to increase Operating Hours Event lists generated by the same fault Alarm ААB A A B Pattern X T C D FAA E D N D BK D F A A BK D DAQ data analytics workshop
Anomaly detection by sensors data mining • Goal: detect abnormal/ unforeseen system behaviours Learning phase • Building a model based on historical data • 3 different algorithms • Correlation index and KNN-graph • K-Mean clustering and probability model • Statistics expert-based model sj sj dij LHC Logging Service si sj Sensors data extraction Anomaly detection • Use the previous model to detect anomalies • On-line analysis over a time window of 1 day • Continuous analysis against thousands of sensors DAQ data analytics workshop
Engineering design PID supervision (CRYO, CV) Recommendation system for WinCC OA users (PSEN) DAQ data analytics workshop
v y u w Controller Process SP MV CV • Evaluation of PID supervision • In collaboration with the University of Valladolid Based on: “Performance monitoring of industrial controllers based on the predictability of controller behaviour”, R. Ghraizi, E. Martinez, C. de Prada • PID performance has an impact on: • Process security • Quality of physics • Maintenance (stress on the equipment) • Issues: • Many sources of faults/malfunctions • System status dependency • External disturbances/factors • Bad tuning • Wrong controller type/structure • Slow degradation DAQ data analytics workshop
PID supervision Ex#1 Bad Good DAQ data analytics workshop
PID supervision Ex#2 Bad Good DAQ data analytics workshop
Recommendation system for WinCC OA users Users’ usage gap analysis Normalized distribution of panels usage Concentrate the effort to optimize the most used panels Users’ actions extraction Jaccard Sequences Similarity Users’ frequent sequences Recommendation of panels based on the specific users’ sequences Recommendation of panels based on users’ sequences similarities DAQ data analytics workshop
Data Analytics Benefits • Increased System Reliability • Minimized forced outages • Complete data analysis • Reduced service effort: weeks hours • 24/7 Expert Knowledge Availability • One central knowledge base Diagnosis support • Identify root causes • More accurate analysis • Accelerate analysis From weeks to hours • Identify hidden patterns Engineering support • Evaluate and improve operational performance • Increase reliability and efficiency by design • Lead control system decisions Operation support • Big data visualization • Forecast system status and take proper actions in time • Prevent possible faults and system downtime DAQ data analytics workshop
Conclusions • Multiple data analytical activities in the experiments • Data analytics brings an important added value to control systems • A price to pay to integrate it into DCS • Many data analytical activities started • in an uncoordinated manner • different technologies (ES, Storm, Esper, DroolsFusion…) • Effort to homogenize all the activities under a common analytic platform DAQ data analytics workshop
Use-cases: a partial list • Online monitoring • Control System Health • Electrical power quality of service • Looking for heat in superconducting magnets • Oscillation in cryogenics valves • Discharge of superconducting magnets heaters • Faults diagnosis • Anomalies in the process regulation • PLC anomalies • Data loss detection • Root-cause analysis for complex WinCC OA installations • Analysis of sensors functioning and data quality • Analysis of LHCb configuration management system • Analysis of OPC-CAN middleware • Data loss in LHCb DAQ • Analysis of electrical power cuts • Cryogenic system breakdowns • Engineering design • Electrical consumption forecast • Efficiency of electric network • Predictive maintenance of control systems elements • Predictive maintenance for control disks storage • Vibration analysis • Efficiency of control process DAQ data analytics workshop