Download
1 / 19
190 likes | 329 Views
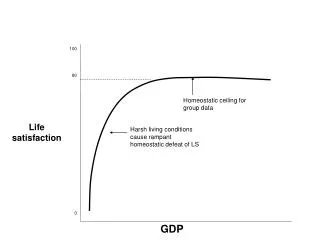
Satisfaction and quality of life SILC longitudinal training. Quality of life : an economic topic. During the 70, works of the school of Leyden (van Praag..) Perception of inequalities Equivalence scales More recently :

E N D
Quality of life : an economic topic • During the 70, works of the school of Leyden (van Praag..) • Perception of inequalities • Equivalence scales • More recently : • Effect on well-being of the macro situation (short term growth, unemployment, …) • Analysis of poverty (Ravallion,..) • One of the three recommendations of the Stiglitz commission • Quality of life and capabilities • Measurement of objective and subjective indicators of well-being SILC longitudinal
Quality of life : a political concern • 2008 : OCDE initiates a project for the measurement of well-being • 2008 : the European Council endorses the principle of an economic growth more in adequacy with the needs of society • 2008 : the French president calls for the Stiglitz report • 2009 : der Bundestag sets up a commission to implement economic indicators to measure well-being • 2010 : the Prime minister of UK orders to ONS a statistical framework to measure well-being SILC longitudinal
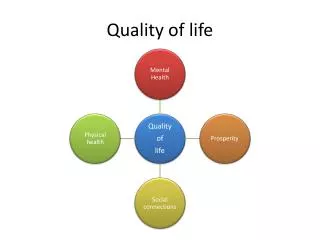
Dimensions of quality of life • We first consider dimensions first related to capabilities • Material living conditions • Health • Education • Productive activities (psychosocial risks) • Governance and individual rights • Leisure and social relationships • Environment • Economic and individual safety • Satisfaction is analysed in a second step • Another side in the literature • Outcome rather capability SILC longitudinal
FR-SILC and well-being : a two-years panel • A possibility to follow the same people • Avoids difficulties related to the heterogeneity of preferences • Underscores statistical causalities rather than correlations • A large survey • 21186 adults in 2010, 22288 in 2011 • 14967 and 15406 people responding to the question on welfare (no proxy) • A little older, more women, fewer students, more retirees, fewer children • Same proportion of people living with partners, same profiles of diploma, same equivalent income • 10897 adults both in 2010 and 2011 • Due to the renewal of the panel • Same composition than cross sections SILC longitudinal
Computation of synthetic indicators for every dimension of the quality of life • Items of privation are gathered by dimension and then aggregated using a usual score method. This assumes that • Items provide consistent information on the underlying dimension • The scoring method eliminates measurement errors coming from data collection The individual position in the dimension worsen with the accumulation of elementary privations • Beyond a certain number privations, the individual is considered in trouble in the dimension • The indicator or poor quality of life equals 1 when the score exceeds a given threshold • This threshold is chosen in order that about 10% of people have difficulties in a given dimension (analogy with poverty in living conditions) SILC longitudinal
Example : differences by income SILC longitudinal
Example : differences according to age SILC longitudinal
Example : differences with urbanization SILC longitudinal
Satisfaction SILC longitudinal
CS 2010 CS 2011 Pooled panel data Estim Wald Estim Wald Estim Wald Year (dummy) -0,03 1,1 Indexes of quality of life Material deprivations -1,04 370,9 -1,08 420,5 -1,1 573,8 Psychosocial risks -0,46 91,2 -0,58 147,9 -0,56 190,6 Economic insecurity -0,31 19,6 -0,26 15,5 -0,28 23,5 Health difficulties -0,71 387,6 -0,75 449,4 -0,71 567,3 Weak social ties -1,61 1218,8 -1,76 1470,5 -1,68 1890,4 Physical insecurity -0,19 19,6 -0,15 12,5 -0,19 26,7 Diff related to the environment -0,22 7,1 -0,25 8,6 -0,33 20,1 Influence of quality of life indexes on satisfaction SILC longitudinal
Econometrics of qualititative variables with panel data : models • Individual unobserved heterogeneity is usually taken into account by an individual effect : Yit=Xit*b+Ui+Wit • With F(Wit/Xi;Ui)=F(Wit) • The true question is about the exogeneity of Ui conditional on Xi (Lechner, Lollivier, Magnac ; The Econometrics of Panel Data) rather to decide if Ui is a fixed or a random effect (only parametric restrictions). • Fixed effect : no parametric assumption on the distribution of U, but implicit correlation between Ui and Xi • Random effect : can be parameterized as Ui=Xi*c+Vi, or as in the Mundlak style Ui=Xi.*c+Vi SILC longitudinal
Econometrics of qualititative variables with panel data : Estimation of static models • No assumption on the distribution of Ui : conditional logit • Loss of efficiency • Only binary variables (high satisfaction and low satisfaction) • Assumption on the distribution of Ui : augmented probit • Yit=Xit*b+Xi.*c+Vi+Wit • Exogeneity F(Vi+Wi/Xi)=F(Vi+Wi) • The pooled probit estimator is consistent and normal • PMV or moment • The matrix variance of this estimator can be computed with bootstrap methods. SILC longitudinal
Estim Wald Year (dummy) -0,07 33,3 Quality of life indicators Material deprivations -0,52 284,7 Psychosocial risks -0,30 201,8 Economic insecurity -0,13 14,2 Health difficulties -0,36 322,8 Weak social ties -0,84 1212,8 Physical insecurity -0,08 19,2 Environmental difficulties -0,13 9,9 Panel estimators : augmented probit SILC longitudinal
Increase welfare Decrease welfare Estim Wald Estim Wald Indicators of quality of life in material deprivations 0,01 0,0 0,58 22,0 Out material deprivations 0,94 61,2 -0,03 0,0 In psychosocial risks -0,27 3,5 0,38 10,5 Out psychosocial risks 0,29 5,8 -0,07 0,2 In economic insecurity 0,03 0,0 0,09 0,3 Out economic insecurity 0,33 4,2 -0,22 1,5 In health difficulties -0,11 1,1 0,40 21,7 Out health difficulties 0,29 9,0 0,13 1,8 In weak social ties -0,49 14,2 1,13 187,5 Out weak social ties 1,03 142,1 -0,41 10,4 In physical insecurity -0,06 0,2 0,22 4,5 Out physical insecurity 0,03 0,1 -0,10 0,8 Worsening environment -0,11 0,2 0,37 4,2 Improving environment 0,13 0,5 0,10 0,3 Effect on satisfaction of changes in quality of life SILC longitudinal
Increase welfare Decrease welfare Estim Wald Estim Wald In unemployment 0,01 0,0 0,73 13,7 Out unemployment 0,75 18,3 -0,28 1,7 With a parter 0,82 24,6 -0,03 0,0 Leave her partner 0,01 0,0 0,24 2,9 Increase of at least one decile of eq income 0,25 13,1 0,01 0,0 Decrease of at least one decile of eq income 0,07 0,9 0,13 3,8 Effect on satisfaction of changes of other variables SILC longitudinal
Interest of panel data for this study • Specific contribution of the longitudinal dimension • Specific doubts about exogeneity of variables • Confirmation of the role played by certain dimensions of QoL • Material deprivation • Social ties • Psychosocial risks • Physical health • Uncertainty about other dimensions • But only two dates for this study SILC longitudinal
Interest of panel data in the study of income and living conditions • Time variability of income • Transitory vs permanent monetary poverty • Between 2003 and 2006, 22% of people have experienced poverty at least one year • 5.3% to 5.9% of people remain poor • 5% to 6.3% leave poverty • 3.9% to 4.8% enter poverty • Dynamics of poverty and quality of life • What dimension comes first ? SILC longitudinal
Thank you for your attention SILC longitudinal