Download
1 / 38
380 likes | 500 Views
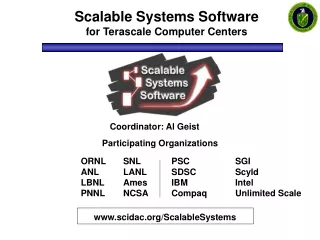
Performance Instrumentation and Measurement for Terascale Systems. Jack Dongarra, Shirley Moore, Philip Mucci University of Tennessee Sameer Shende, and Allen Malony University of Oregon. Requirements for Terascale Systems. Performance framework must support a wide range of

E N D
Performance Instrumentation and Measurement for Terascale Systems Jack Dongarra, Shirley Moore, Philip Mucci University of Tennessee Sameer Shende, and Allen Malony University of Oregon ICCS 2003
Requirements for Terascale Systems • Performance framework must support a wide range of • Performance problems (e.g., single-node performance, synchronization and communication overhead, load balancing) • Performance evaluation methods (e.g., parameter-based modeling, bottleneck detection and diagnosis) • Programming environments (e.g., multiprocess and /or multithreaded, parallel and distributed, large-scale) • Need for flexible and extensible performance observation framework ICCS 2003
Research Problems • Appropriate level and location for implementing instrumentation and measurement • How to make the framework modular and extensible • Appropriate compromise between level of detail/accuracy and instrumentation cost ICCS 2003
Instrumentation Strategies • Source code instrumentation • Manual or using preprocessor • Library level instrumentation • e.g., MPI and OpenMP profiling interfaces • Binary rewriting • E.g., Pixie, ATOM, EEL, PAT • Dynamic instrumentation • DyninstAPI ICCS 2003
Types of Measurements • Profiling • Tracing • Real-time Analysis ICCS 2003
Profiling • Recording of summary information during execution • inclusive, exclusive time, # calls, hardware statistics, … • Reflects performance behavior of program entities • functions, loops, basic blocks • user-defined “semantic” entities • Very good for low-cost performance assessment • Helps to expose performance bottlenecks and hotspots • Implemented through • sampling: periodic OS interrupts or hardware counter traps • instrumentation: direct insertion of measurement code ICCS 2003
Tracing • Recording of information about significant points (events) during program execution • entering/exiting code region (function, loop, block, …) • thread/process interactions (e.g., send/receive message) • Save information in event record • timestamp • CPU identifier, thread identifier • Event type and event-specific information • Event trace is a time-sequenced stream of event records • Can be used to reconstruct dynamic program behavior • Typically requires code instrumentation ICCS 2003
Real-time Analysis • Allows evaluation of program performance during execution • Examples • Paradyn • Autopilot • Perfometer ICCS 2003
TAU Performance System Architecture Paraver EPILOG ICCS 2003
TAU Instrumentation • Manually using TAU instrumentation API • Automatically using • Program Database Toolkit (PDT) • MPI profiling library • Opari OpenMP rewriting tool • Uses PAPI to access hardware counter data ICCS 2003
Program Database Toolkit (PDT) • Program code analysis framework for developing source-based tools • High-level interface to source code information • Integrated toolkit for source code parsing, database creation, and database query • commercial grade front end parsers • portable IL analyzer, database format, and access API • open software approach for tool development • Targets and integrates multiple source languages • Used in TAU to build automated performance instrumentation tools ICCS 2003
PDT Components • Language front end • Edison Design Group (EDG): C, C++ • Mutek Solutions Ltd.: F77, F90 • creates an intermediate-language (IL) tree • IL Analyzer • processes the intermediate language (IL) tree • creates “program database” (PDB) formatted file • DUCTAPE (Bernd Mohr, ZAM, Germany) • C++ program Database Utilities and Conversion Tools APplication Environment • processes and merges PDB files • C++ library to access the PDB for PDT applications ICCS 2003
TAU Analysis • Profile analysis • pprof • parallel profiler with text-based display • Racy / jRacy • graphical interface to pprof (Tcl/Tk) • jRacy is a Java implementation of Racy • ParaProf • Next-generation parallel profile analysis and display • Trace analysis and visualization • Trace merging and clock adjustment (if necessary) • Trace format conversion (ALOG, SDDF, Vampir) • Vampir (Pallas) trace visualization • Paraver (CEPBA) trace visualization ICCS 2003
TAU Pprof Display ICCS 2003
jracy (NAS Parallel Benchmark – LU) Routine profile across all nodes Global profiles n: node c: context t: thread Individual profile ICCS 2003
ParaProf Scalable Profiler • Re-implementation of jRacy tool • Target flexibility in profile input source • Profile files, performance database, online • Target scalability in profile size and display • Will include three-dimensional display support • Provide more robust analysis and extension • Derived performance statistics ICCS 2003
ParaProf Architecture ICCS 2003
512-Processor Profile (SAMRAI) ICCS 2003
Three-dimensional Profile Displays 500-processor Uintah execution (University of Utah) ICCS 2003
Overviewof PAPI • Performance Application Programming Interface • The purpose of the PAPI project is to design, standardize and implement a portable and efficient API to access the hardware performance monitor counters found on most modern microprocessors. • Parallel Tools Consortium project • References implementations for all major HPC platforms • Installed and in use at major government labs, academic sites • Becoming de facto industry standard • Incorporated into many performance analysis tools – e.g., HPCView,SvPablo, TAU, Vampir, Vprof ICCS 2003
PAPI Counter Interfaces • PAPI provides three interfaces to the underlying counter hardware: • The low level interface provides functions for setting options, accessing native events, callback on counter overflow, etc. • The high level interface simply provides the ability to start, stop and read the counters for a specified list of events. • Graphical tools to visualize information. ICCS 2003
Tools PAPI Low Level PAPI High Level Portable Layer PAPI Machine Dependent Substrate Machine Specific Layer Kernel Extension Operating System Hardware Performance Counter PAPI Implementation ICCS 2003
PAPI Preset Events • Proposed standard set of events deemed most relevant for application performance tuning • Defined in papiStdEventDefs.h • Mapped to native events on a given platform • Run tests/avail to see list of PAPI preset events available on a platform ICCS 2003
Scalability of PAPI Instrumentation • Overhead of library calls to read counters can be excessive. • Statistical sampling can reduce overhead. • PAPI substrate for Alpha Tru64 UNIX • Built on top of DADD/DCPI (Dynamic Access to DCPI Data/Digital Continuous Profiling Interface) • Sampling approach supported in hardware • 1-2% overhead compared to 30% on other platforms • Using sampling and hardware profiling support on Itanium/Itanium2 ICCS 2003
Vampir v3.x: Hardware Counter Data • Counter Timeline Display ICCS 2003
What is DynaProf? • A portable tool to instrument a running executable with Probes that monitor application performance. • Simple command line interface. • Open Source Software • A work in progress… No source code required ICCS 2003
DynaProf Methodology • Make collection of run-time performance data easy by: • Avoiding instrumentation and recompilation • Using the same tool with different probes • Providing useful and meaningful probe data • Providing different kinds of probes • Allowing custom probes No source code required! ICCS 2003
Why the “Dyna”? • Instrumentation is selectively inserted directly into the program’s address space. • Why is this a better way? • No perturbation of compiler optimizations • Complete language independence • Multiple Insert/Remove instrumentation cycles ICCS 2003
DynaProf Design • GUI, command line & script driven user interface • Uses GNU readline for command line editing and command completion. • Instrumentation is done using: • Dyninst on Linux, Solaris and IRIX • DPCL on AIX ICCS 2003
DynaProf Commands load <executable> list [module pattern] use <probe> [probe args] instr module <module> [probe args] instr function <module> <function> [probe args] stop continue run [args] Info unload ICCS 2003
DynaProf Probe Design • Probes provided with distribution • Wallclock probe • PAPI probe • Perfometer probe • Can be written in any compiled language • Probes export 3 functions with a standardized interface. • Easy to roll your own (<1day) • Supports separate probes for MPI/OpenMP/Pthreads ICCS 2003
Future development • GUI development • Additional probes • Perfex probe • Vprof probe • TAU probe • Better support for parallel applications ICCS 2003
Perfometer • Application is instrumented with PAPI • call perfometer() • call mark_perfometer(int color, char *label) • Application is started. At the call to perfometer, signal handler and a timer are set up to collect and send the information to a Java applet containing the graphical view. • Sections of code that are of interest can be designated with specific colors • Real-time display or trace file ICCS 2003
Machine info Flop/s Rate Flop/s Min/Max Process & Real time Perfometer Display ICCS 2003
Perfometer Parallel Interface ICCS 2003
Conclusions • TAU and PAPI projects are addressing important research problems involved in constructing a flexible and extensible performance observation framework. • Widespread adoption of PAPI demonstrates the value of a portable interface to low-level architecture-specific performance monitoring hardware. • TAU framework provides flexible mechanisms for instrumentation and measurement. ICCS 2003
Conclusions (cont.) • Terascale systems require scalable low-overhead means of collecting performance data. • Statistical sampling support in PAPI • TAU filtering and feedback schemes for focusing instrumentation • Real-time monitoring capabilities (Dynaprof, Perfometer) • PAPI and TAU infrastructure is designed for interoperability, flexibility, and extensibility. ICCS 2003
More Information • TAU (http://www.acl.lanl.gov/tau) • PDT (http://www.acl.lanl.gov/pdtoolkit) • PAPI (http://icl.cs.utk.edu/papi/) • OPARI (http://www.fz-juelich.de/zam ICCS 2003