Statistical Challenges in Climatology
340 likes | 517 Views
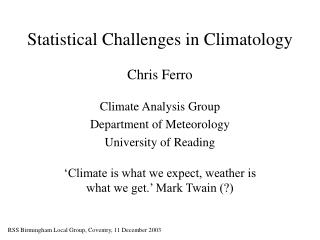
Statistical Challenges in Climatology. Chris Ferro Climate Analysis Group Department of Meteorology University of Reading ‘Climate is what we expect, weather is what we get.’ Mark Twain (?). RSS Birmingham Local Group, Coventry, 11 December 2003. Overview. History and general issues

Statistical Challenges in Climatology
E N D
Presentation Transcript
Statistical Challenges in Climatology Chris Ferro Climate Analysis Group Department of Meteorology University of Reading ‘Climate is what we expect, weather is what we get.’ Mark Twain (?) RSS Birmingham Local Group, Coventry, 11 December 2003
Overview • History and general issues • Examples of research topics • Climate change simulations • Concluding remarks
History southern oscillation ‘primitive’ equations manual forecast computer forecasts 40 Tflops 10 Tbytes 1904 1922 1923 1950 2002 Vilhelm Bjerknes Lewis Fry Richardson Gilbert Walker Jule G. Charney The Earth Simulator
General Issues Dependent Nonstationary Huge datasets Limited data space and time: many scales space and time: periodicities, shocks, external forcings station, satellite, simulation short record, no replication
Examples of Research Topics • Observations • Climate modes • Numerical models • Data assimilation • Forecast calibration • Other topics
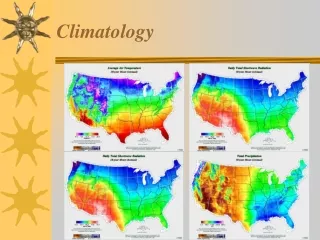
Observations Buoys Field Stations Ships & Aircraft Satellites Radiosondes Palaeo-records homogeneity, missing data, errors and outliers network design and adaptive observations statistical models to reconstruct past climates
Principal components: multi-site observations Identifies patterns of simultaneous variation Physical significance Reduces dimension Rotated, simplified etc. Climate Modes North Atlantic Oscillation, courtesy of Abdel Hannachi
General Circulation Models • Differential equations • Physical schemes • External forcings • Initial conditions • Numerical scheme • Deterministic output: temp, precip, wind, pressure etc.
Data Assimilation State Observation Solution • Assumptions, approximations, choice of
Forecast Calibration climate model Caio Coelho & Sergio Pezzulli Prior: climate-model forecast Likelihood: regression model regression model combined
Other Topics • Model validation • Forecast verification • Statistical downscaling • Climate change attribution • Stochastic models of processes
Climate Change Simulations • The PRUDENCE project • Temperature and precipitation • Distributional changes • Extreme values • Model uncertainty
PRUDENCE • European Climate • 30-year control simulation, 1961-1990 • 30-year A2 scenario simulation, 2071-2100 • 10 high-resolution regional models • 6 global models From www.ipcc.ch
Mean Daily Rainfall Control (1961-1990) Scenario – Control mm mm
Mean Daily Rainfall Control (1961-1990) Scenario – Control DJF MAM DJF MAM JJA SON JJA SON mm mm
Mean Daily Rainfall Response DJF JJA
Mean Daily Rainfall Response DJF JJA
Mean Temperature Control (1961-1990) Scenario – Control ºC ºC
Mean Temperature Control (1961-1990) Scenario – Control DJF MAM DJF MAM JJA SON JJA SON ºC ºC
Model Uncertainty Annual Mean Scenario Model Year
Rainfall 10-DJF Return Levels Control A2 Scenario / Control
Scale-change Model p-value
Concluding Remarks Need for sophisticated statistical techniques to help to analyse large amount of complex data. ‘There is, to-day, always a risk that specialists in two subjects, using languages full of words that are unintelligible without study, will grow up not only, without knowledge of each other’s work, but also will ignore the problems which require mutual assistance.’ Sir Gilbert Walker, 1927
PRUDENCE Climate Analysis Group 9th International Meeting on Statistical Climatology, Cape Town, 24-28 May 2004 prudence.dmi.dk www.met.rdg.ac.uk/cag www.csag.uct.ac.za/IMSC Further Information c.a.t.ferro@reading.ac.uk