Download

1 / 19
190 likes | 403 Views
Atomic and molecular data for Active Galactic Nuclei – Fe II lines and Balmer continuum. Jelena Kova č evi ć Astronomical Observatory Belgrade. Outline:. Active Galactic Nuclei (AGN) : basic properties Some examples of use of atomic databases in AGN investigation

E N D
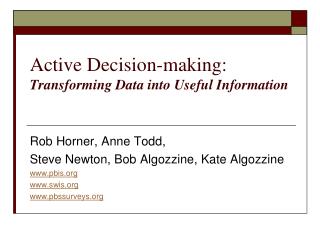
Atomic and molecular data for Active Galactic Nuclei– Fe II lines and Balmer continuum Jelena Kovačević Astronomical Observatory Belgrade
Outline: • Active Galactic Nuclei (AGN): basic properties • Some examples of use of atomic databases in AGN investigation 2.1Construction of the Fe II template 2.2Calculation of Balmer continuum • Conclusions
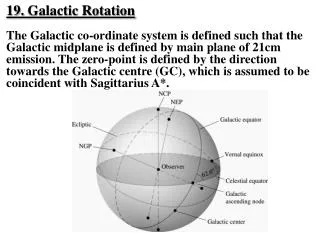
1. Active Galactic Nuclei (AGN): basic properties Standard Unification Model: blasar Sy 1, QSO 1 Sy 2, QSO 2
2.1Construction of the Fe II template • Why Fe II lines are interesting? • Unknown mechanism of excitation! • (observed Fe II emission cannot be well • explained by standard photoionization • models!) • Unknown place of Fe II emission • region in AGN structure! • 3. Some unexplained correlations between • Fe II lines and some other spectral • properties: what is the physics behind? Hb Fe II (λλ4400 -5500 Å) intensity wavelength (A) wavelength (A) We need a good Fe II template in order to: 1. answer to these questions, 2. investigate Hβ and [O III] lines which overlap with Fe II;
2.1 Construction of the Fe II template Why the construction of iron template is difficult? • empirical template • complex Fe II ion: many transitions, • difficult identification of the lines! • theoretical template • unknown mechanism of excitation of all Fe II • lines. Except the photoionization, there are • probably some additional mechanisms: • continuum flourescence(Philips 1978, 1979) • collisional excitation (Joly 1981, 1987, 1991) • self- flourescence among Fe II transitions • (Netzer & Wills 1983) • flourescent excitation by the Lyα and Lyβ lines • (Penston 1988, Verner et al. 1999) Difficult calculation of their relative intensities! intensity Sigut & Pradhan, 2003 wavelength (A) wavelength (A)
2.1Construction of the Fe II template To investigate the Fe II emission, we made an Fe II template, taking into account following: (a) majority of Fe II multiplets dominant in λλ4400 -5500 Å range, have one of three specific lower terms of their transitions: 3d6 (3F2)4s 4F, 3d5 4s26S or 3d6 (3G)4s 4G (hereinafter F, S and G groups of lines), (b) beside these lines there are also lines whose origin is not well known, and probably originate from higher levels
2.1Construction of the Fe II template The constructed Fe II template consists of: • 35 lines, which describe 75% of Fe II emission in λλ4400 -5500 Å range, and belong toF, S or G groups. The relative intensities of lines within one line group are calculated using the formula: • 15 lines, which probably originate from higher levels, and make about 25% of the Fe II emission. Their relative intensities are taken from I Zw 1 object (I Zw 1 group).
2.1Construction of the Fe II template • This was difficult because: • difference in wavelengths of the • same lines in different sources, • significant difference between • values of oscillator strengths for • the same line in different sources. Wavelengths (λ), oscillator strengths (f), statistical weights (g), energies of upper level of transition (E), obtained from: Fuhr et al. 1981 Giridhar & Ferro 1995 NIST Atomic Spectra Database Kurucz 1990 Iron Project, Hummer 1993
2.1Construction of the Fe II template • The template is described with 7 free parameters: - 4 parameters of intensity - for Fe II lines from F, S and G line groups and for I Zw 1 group, - one parameter of the width and one of the shift (since we assume that all iron lines have the same width and shift), - excitation temperature;
Kovačević et al. 2010 Kovačević et al. 2010 Veron-Cetty et al. 2004 This template enables very good fit, specially in the cases where there is a big discrepancy between the intensities of the red and the blue iron shelf (F and G line groups). Veron-Cetty et al. 2004 Bruhweiler and Verner 2008 Bruhweiler and Verner 2008
2.1Construction of the Fe II line template • This Fe II template enabled a precise fit of Fe II lines, and investigation of • different parts of Fe II shelf (F, S, G). • We found: • that Fe II lines probably originate • from Intermediate Line Region in AGN. • 2. Different behavior of different parts of • Iron shelf, which is signature of some physical • processes: logLconF/G and F/S FWHM HbF/G, F/S, G/S Published in Kovačević et al. 2010, ApJS, 189, 15.
2.2 Calculation of Balmer continuum • to investigate UV part of spectra: • 1 step: determinationofthe UV pseudocontinuum in the sample! • Not easy because: 1. complex shape of UV pseudocontinuum: Power low + Balmer continuum(Grandi 1982) 2. Our sample contains spectra within spectral range: 2900 A – 5500 A (SDSS) (only two continuum windows : ~4200 A and ~5100A! Complex shape of UV pseudocontinuum cannot be fitted well! Tsuzuki et al. 2006
2.2 Calculation of Balmer continuum Tsuzuki et al. 2006, Sameshima et al. 2010 Sameshima et al. 2010
2.2 Calculation of Balmer continuum Jin et al. 2012 Convolving Balmer continuum equation with Gaussian (FWHM Gaussian = FWHM broad Hβ)
Our model of Balmer continuum • We try to make model which: - we could use for fitting spectra within 2900 A – 5500 A range(with two continuum windows). It could be done by reducing number of free parameters: calculating the intensity of Balmer continuum! - we try to make good fit near Balmer edge (3646 A)! Our model consists of: Power law + Balmer continuum (λ<3646A) + high order Balmer lines (n=3-400), (λ>3646A) They are fitted by one Gaussian with the same width and shift as Hγ. -The relative intensites for Balmer lines with n<50 are taken from the paper: Storey and Hummer 1995, where line emissivities, effective recombination coefficients, opacity factors, recombination coefficients, etc. are calculated for hydrogenic ions (z<9, n<50) - No data for 50<n<400! - Relative intensities for 50<n<400 are calculated using approximate formula: ≈1
Conclusions: • The calculated optical iron template enables detailed investigation of Fe II lines in AGN spectra, which are telling us about AGN physics and geometry. • Model with high order Balmer lines n=3-400, for λ>3646A, improve the fit near Balmer edge, and enables the calculation of the intensity of Balmer continuum. This is specially important in case of using luminosity at 3000 A, for calculation of black hole mass. • The data basis with large and complete atomic data may help a lot in analysis of AGN spectra, and understanding of AGN nature. Thank you for your attention!