Download
1 / 42
450 likes | 593 Views
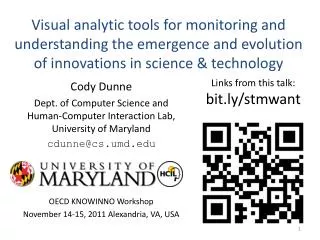
Visual analytic tools for monitoring and understanding the emergence and evolution of innovations in science & technology. Links from this talk: bit.ly/ stmwant. Cody Dunne Dept. of Computer Science and Human-Computer Interaction Lab, University of Maryland cdunne@cs.umd.edu

E N D
Visual analytic tools for monitoring and understanding the emergence and evolution of innovations in science & technology Links from this talk: bit.ly/stmwant Cody Dunne Dept. of Computer Science and Human-Computer Interaction Lab, University of Maryland cdunne@cs.umd.edu OECD KNOWINNO Workshop November 14-15, 2011 Alexandria, VA, USA
Outline • Academic literature exploration • Case study: Tree visualization techniques • Case study: Business intelligence news • Case study: Pennsylvania innovations • STICK approach
1. Academic literature exploration Users are looking for: • Foundations • Emerging research topics • State of the art/open problems • Collaborations & relationships between Communities • Field evolution • Easily understandable surveys
User requirements • Control over the paper collection • Choose custom subset via query, then iteratively drill down, filter, & refine • Overview either as visualization or text statistics • Orient within subset • Easy to understand metrics for identifying interesting papers • Ranking & filtering • Create groups & annotate with findings • Organize discovery process • Share results
Action Science Explorer • Bibliometriclexical link mining to create a citation network and citation context • Network clustering and multi-document summarization to extract key points • Potent network analysis and visualization tools www.cs.umd.edu/hcil/ase
2. Case study: Tree visualization • Problem: Traditional 2D node-link diagrams of trees become too large • Solutions: • Treemaps: Nested Rectangles • Cone Trees: 3D Interactive Animations • Hyperbolic Trees: Focus + Context • Measures: • Papers, articles, patents, citations,… • Press releases, blog posts, tweets,… • Users, downloads, sales,…
Treemaps: nested rectangles www.cs.umd.edu/hcil/treemap-history
SmartmoneyMarketMap Feb 27, 2007 smartmoney.com/marketmap
Cone trees: 3D interactive animations Robertson, G. G., Card, S. K., and Mackinlay, J. D., Information visualization using 3D interactive animation, Communications of the ACM, 36, 4 (1993), 51-71. Robertson, G. G., Mackinlay, J. D., and Card, S. K., Cone trees: Animated 3D visualizations of hierarchical information, Proc. ACM SIGCHI Conference on Human Factors in Computing Systems, ACM Press, New York, (April 1991), 189-194.
Hyperbolic trees: focus & context Lamping, J. and Rao, R., Laying out and visualizing large trees using a hyper-bolic space, Proc. 7th Annual ACM symposium on User Interface Software and Technology, ACM Press, New York (1994), 13-14. Lamping, J., Rao, R., and Pirolli, P., A focus+context technique based on hy-perbolic geometry for visualizing large hierarchies, Proc. SIGCHI Conference on Human Factors in Computing Systems, ACM Press, New York (1995), 401-408.
Tree visualization publishing TM=Treemaps CT=Cone Trees HT=Hyperbolic Trees Trade Press Articles Academic Papers Patents
Tree visualization citations TM=Treemaps CT=Cone Trees HT=Hyperbolic Trees Academic Papers Patents
Insights • Emerging ideas may benefit from open access • Compelling demonstrations with familiar applications help • Many components to commercial success • 2D visualizations w/spatial stability successful • Term disambiguation & data cleaning are hard Shneiderman, B., Dunne, C., Sharma, P. & Wang, P. (2011), "Innovation trajectories for information visualizations: Comparing treemaps, cone trees, and hyperbolic trees", Information Visualization. http://www.cs.umd.edu/localphp/hcil/tech-reports-search.php?number=2010-16
PQ Business Intelligence 2000-2009Co-occurrence of concepts with organizations • Data Mining • National Security Agency • NSA • White House • FBI • AT&T • American Civil Liberties Union • Electronic Frontier Foundation • Dept. of Homeland Security • CIA Frequency Year
Business Intelligence 2000-2009 Matrix showing Co-Occurrence of concepts and orgs.
Business Intelligence 2000-2009: (subset)
Business Intelligence • 2000-2009: • Data mining • NSA • CIA • FBI • White House • Pentagon • DOD • DHS • AT&T • ACLU • EFF • Senate Judiciary Committee
Business Intelligence • 2000-2009: • Tech1 • Google • Yahoo • Stanford • Apple • Tech2 • IBM, Cognos • Microsoft • Oracle • Finance • NASDAQ • NYSE • SEC • NCR • MicroStrategy
Business Intelligence • 2000-2009: • Air Force • Army • Navy • GSA • UMD*
Insights • Useful groupings in PQ BI terms based on events and long-term collaborators • Interactive line charts useful for looking at co-occurrence relationships over time • Clustered heatmaps useful for overall co-occurrence relationships stick.ischool.umd.edu
4. Case study: Pennsylvania innovations • Innovation relationships during 1990 • State & federal funding • Patents (both strong and weak ties) • Location • Connecting • State & federal agencies • Universities • Firms • Inventors
Patent Tech SBIR (federal) PA DCED (state) Related patent 2: Federal agency 3: Enterprise 5: Inventors 9: Universities 10: PA DCED 11/12: Phil/Pitt metro cnty 13-15: Semi-rural/rural cnty 17: Foreign countries 19: Other states
Patent Tech SBIR (federal) PA DCED (state) Related patent 2: Federal agency 3: Enterprise 5: Inventors 9: Universities 10: PA DCED 11/12: Phil/Pitt metro cnty 13-15: Semi-rural/rural cnty 17: Foreign countries 19: Other states
No Location Philadelphia Patent Tech Navy SBIR (federal) PA DCED (state) Related patent 2: Federal agency Pharmaceutical/Medical 3: Enterprise 5: Inventors Pittsburgh Metro 9: Universities 10: PA DCED 11/12: Phil/Pitt metro cnty 13-15: Semi-rural/rural cnty 17: Foreign countries Westinghouse Electric 19: Other states
No Location Philadelphia Patent Tech Navy SBIR (federal) PA DCED (state) Related patent 2: Federal agency Pharmaceutical/Medical 3: Enterprise 5: Inventors Pittsburgh Metro 9: Universities 10: PA DCED 11/12: Phil/Pitt metro cnty 13-15: Semi-rural/rural cnty 17: Foreign countries Westinghouse Electric 19: Other states
Insights • Meta-layouts useful for showing: • Groups (clusters, attributes, manual) • Relationships between them • User comments • “We've never been able to see anything like this“ • “This is going to be huge" www.terpconnect.umd.edu/~dempy/
5. STICK approach • NSF SciSIP Program • Science of Science & Innovation Policy • Goal: Scientific approach to science policy • The STICK Project • Science & Technology Innovation Concept Knowledge-base • Goal: Monitoring, Understanding, and Advancing the (R)Evolution of Science & Technology Innovations
STICK approach cont… • Scientific, data-driven way to track innovations • Vs. current expert-based, time consuming approaches (e.g., Gartner’s Hype Cycle, tire track diagrams) • Includes both concept and product forms • Study relationships between • Study the innovation ecosystem • Organizations & people • Both those producing & using innovations stick.ischool.umd.edu
STICK Process (overview) News Dissertation Academic Patent Blogs • Identify concepts • Business intelligence, cloud computing, customer relationship management, health IT, web 2.0, electronic health records, biotech • Query data sources • Processing • Automatic entity recognition • Crowd-sourced verification • Co-occurrence networks • Visualizing & analyzing • Overall statistics • Co-occurrence networks • Network evolution • Sharing results
Process • Collecting • Processing • Visualizing & Analyzing • Collaborating Cleaning
Collecting Identify Concepts Data Sources News Dissertation Academic Patent Blogs • Begin with target concepts • Business Intelligence • Health IT • Cloud Computing • Customer Relationship Management • Web 2.0 • Personal Health Records • Nanotechnology • Develop 20-30 sub concepts from domain experts, wikis
Collecting (2) • Form & Expand Queries ABS( "customer relationship management" OR "customers relationship management" OR "customer relation management" ) OR TEXT(…) OR SUB(…) OR TI(…) • Scrape Results
Processing Automatic Entity Recognition Crowd-Sourced Verification Extract most frequent 25% Assign to CrowdFlower Workers check organization names and sample sentences • BBN IdentiFinder
Processing (2) • Compute Co-Occurrence Networks • Overall edge weights • Slice by time to see network evolution • Output CSV GraphML
Visualizing & Analyzing Spotfire NodeXL CSV, Spigots, GraphML Automate feature Batch analysis & visualization Excel 2007/2010 template • Import CSV, Database • Standard charts • Multiple coordinated views • Highly scalable
Shared data & analysis repositories • Online Research Community • Share data, tools, results • Data & analysis downloads • Spotfire Web Player • Communication • Co-creation, co-authoring stick.ischool.umd.edu/community
Outline • Academic literature exploration • Citation networks and text summarization • Case study: Tree visualization techniques • Papers, patents, and trade press articles • Case study: Business intelligence news • News term co-occurrence • Case study: Pennsylvania innovations • Patents, funding, and locations • STICK approach • Tracking innovations across papers, patents, news articles, and blog posts
Take Away Messages • Easier scientific, data-driven innovation analysis: • Automatic collection & processing of innovation data • Easy access to visual analytic tools for finding clusters, trends, outliers • Communities for sharing data, tools, & results
Visual analytic tools for monitoring and understanding the emergence and evolution of innovations in science & technology Links from this talk: bit.ly/stmwant Cody Dunne Dept. of Computer Science and Human-Computer Interaction Lab, University of Maryland cdunne@cs.umd.edu This work has been partially supported by NSF grants IIS 0705832 (ASE) and SBE 0915645 (STICK)