Download
1 / 10
100 likes | 293 Views
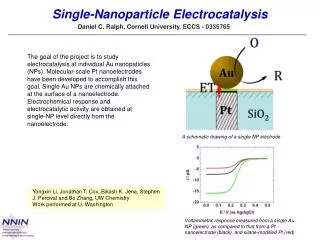
Measurement of the Complex Dielectric Constant of a Single Gold Nanoparticle. Nick Vamivakas. Journal Club 07.31.06. Primary Reference:. Patrick Stoller, Volker Jacobsen, Vahid Sandoghdar. Optics Letters 31, 2474-2476 (2006). Problem.

E N D
Measurement of the Complex Dielectric Constant of a Single Gold Nanoparticle Nick Vamivakas Journal Club 07.31.06 Primary Reference: Patrick Stoller, Volker Jacobsen, Vahid Sandoghdar Optics Letters 31, 2474-2476 (2006)
Problem Optically characterize plasmon resonances in “small” diameter gold nanoparticles (few nm) Why is this hard? strength Rayleigh scattered light ~ diameter6 One approach: Boyer, et al Science 2002 -> absorption ~ diameter3 photothermal effect leads to measurable index contrast
Solution Homodyne the pump laser with the Rayleigh scattered light Schematically scatter, Es pump, Eo |E|2 dipole diameter D Measure the intensity of the total field on the detector |E|2= |Eine-iπ/2+Ein|α|e-iФ|2 = |Ein|2(1+|s|2-2|α|sinФ) where α ~D3 and is particle polarizability Interference cross-term scales with D3 !!!
Technique: Differential Interference Contrast Polarizing Elements Axes λ/4 circular λ/4f NWf NWs NW Ws linear Wf λ/4s E2 E1 Field Vectors Ws =B E1 E2 Wf =A elliptical W linear Wollaston projects channels 1 and 2 onto A and B axis A = E1-E2 B = E1+E2
Differential Interference Contrast with Spectral Information Folded version of the previous DIC spectral detector E1 |E1-E2(λ)|2 |E1+E2(λ)|2 E2 63x, 1.4NA w/ oil immersion (εm=2.3) E1=Eoα(λ)=Eo|α(λ)|exp(iarg[α(λ)]) where polarizability is α(λ) = εm (πD3/2) [εg(λ)-εm] / (πεg(λ)+2εm)] E2=Eo r exp(-iπ/2) Guoy phase
Differential Interference Contrast with Spectral Information Folded version of the previous DIC spectral detector E1 |E1-E2(λ)|2 |E1+E2(λ)|2 E2 63x, 1.4NA w/ oil immersion (εm=2.3) X(λ) = (2/εmπD3)α(λ) Define diameter independent Show Xre(λ) = F(A-B) and Xim(λ) = G(A-B,A+B) Which can further be related to εre,g and εim,g
The Dielectric Function D=15nm (a) and (b) show Xre(λ) and Xim(λ), solid is fit using quasi-static approx and bulk gold dielectric from literature (c) and (d) calculate εre,g and εim,gfrom Xre(λ) and Xim(λ) ; solid is measured bulk gold dielectric TEM to rule out particle ellipticity induced deviation
The Average Dielectric Function 13 10nm particles and 15 15nm particles dashed lines incorporate surface damping into εim,g good agreement in region of plasmon resonance (510-580nm) but disagreement below 510nm between bulk and sphere in εim,g (speculate on broadening)
Conclusion Measured dielectric function of 10 and 15nm gold nanoparticles interferometrically in DIC microscope Quasi-white light source and spectral detection accessed all wavelength channels simultaneously Observed plasmon resonance in these diameter nanoparticles spectrally similar to that of bulk gold