String Kernel Methods for Protein Classification
300 likes | 385 Views
Explore the use of Mismatch-SVM in protein classification, comparing it with Fisher-SVM. Learn about the computational efficiency and advantages of the mismatch kernel in this informative paper.

String Kernel Methods for Protein Classification
E N D
Presentation Transcript
Mismatch String Kernals for SVM Protein Classification Christina Leslie, Eleazar Eskin, Jason Weston, William Stafford Noble Presented by Pradeep Anand Ravindranath Mei Sze Lam
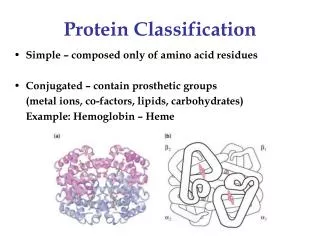
Introduction • Problem in Computational Biology • Classification of Proteins into functional and structural classes based on homology of protein sequence data
Methods for Protein Classification and Homology Detection • Pairwise sequence alignment • Profiles for protein families • Consensus patterns using motifs • Profiles HMMs
Focus • Remote Homology Detection
How is the problem handled currently? • Fisher-SVM One of the successful discriminative techniques for protein classification and Best performing method for remote homology detection
Fisher-SVM • Build a profile HMM for the positive training sequences, defining loglikelihood function [log P(x/θ)] for any protein sequence x. • θ0 - maximum likelihood for model parameters
Gradient vector d(log P(x/θ)/θ=θ0)/dθassigns to each (positive or negative) training sequence x an explicit vector feature called fisher scores. • This feature mapping defines a kernel function, called the fisher kernel. • This Fisher kernel can then be used to train a SVM classifier.
Strengths • Combines biological information encoded in a HMM with the discriminative power of the SVM algorithm.
Negatives • Needs lots of data or sophisticated priors to train the HMM. • It is expensive to compute the kernel matrix, as calculating the fisher scores requires computing forward and backward probabilities from the Baun-Welch algorithm.
Mismatch-SVM • The (k,m)-mismatch kernel is based on a feature map to a vector space indexed by all possible subsequence of amino acids of a fixed length k. • Each instance of a fixed k-length subsequence in an input sequence attributes to all feature coordinates differing from it by at most m mismatches.
Thus, the mismatch kernel adds the biologically important idea of mismatching to the computationally simpler • In this paper, it is described how to compute the new kernel efficiently using a for values of (k,m) useful in this application. spectrum kernel mismatch tree data structure Mismatch kernel
Advantages • By using mismatch tree data structure the kernel is fast enough to use on real datasets. • Considerabily less expensive than the fisher kernel. • Performance equal to Fisher-SVM. • Outperforms other methods.
This kernel does not depend on any generative model and can be used for other sequence based classification problems.
Feature Maps for Strings • (k,m)-mismatch kernel is based on a feature map from the space of all finite sequences from an alphabet A of size |A| = l to the lk –dimensional vector space indexed by the set of k-length subsequences (“k-mers”) from A. where, A - alphabet representing amino acids. l - no. of amino acids.
If α is a k-mer βis all k length sequences N(k,m) (α) – set of all k length sequences differing from αby at most m mismatches. we define our feature map Φ(k,m) as Φ(k,m) (α) = (φβ(α))βЄAk where φβ(α) = 1if βbelongs to N(k,m) (α) , φβ(α) = 0 otherwise.
For a sequence x of any length, we extends the map additively by summing the feature vectors for all the k-mers in x: Φ(k,m) (x) = Σ(k-mers α in x)Φ(k,m) (α) • The (k,m)-mismatch kernal is given by K (k,m) (x,y) = ‹Φ(k,m) (x), Φ(k,m) (y)›. For m = 0, we retrieve the k-spectrum kernal.
Fisher Scores and Spectrum Kernel • Even though the spectrum and mismatch feature maps are defined without any reference to a generative model, there is some similarity between the k-spectrum feature map and the fisher scores associated to an order k-1 markov chain model.
Efficient computation of the Mismatch Kernel: Mismatch Tree Data Structure • Mismatch tree data structure is used to represent the feature space(the set of all k-mers) and perform a lexical traversal of all k-mers occurring in the sample dataset match with up to m of mismatches.
Example: Traversing the Mismatch Tree • Traversal for input sequence: AVLALKAVLL, k=8, m=1
Example: Computing the Kernel for Pair of Sequences • Traversal of trie for k=3 (m=0) A S1: EADLALGKAVF EADLALGKAVF EADLALGKAVF D S2: ADLALGADQVFNG ADLALGADQVFNG ADLALGADQVFNG L Update kernel value for K(s1,s2) by adding contribution for feature ADL
Efficiency Issues for Kernel Computation • Depth first search • Recursive function efficient use of memory no problem for large data sets
Computational Cost Number of mismatches, m. This increases, computational cost increases exponentially Theoretical Computational Cost, O Total length of the sample data, N Number of different amino acids in the body The number of characters in the sequence, k. The classifier breaks up proteins into lengths of 5~6. (Longer strings are broken down by summing the feature vectors)
= M x M x n = M X N • Where is just the M number of sequences to be processed. • Supposing M number of sequences are all equal with max. no of non zero entities Computational Cost (cont’d) • Worst case scenario for M sequences ?
Training and Test Data 33 Classes of Superfamily Proteins (taken from SCOP database) Class we are interested in Any other class other than Class 1 Class 1 Class 2 Class 3 .. - - + - + - - + - - + - - - Families of Proteins, each belonging to 1 of 33 Superfamilies • For each class, we want to know whether a given protein sequence belongs to that class – Y/N? • 160 experiments were performed on 33 classes.
Implementation and Comparison of Methods • We test the mismatch kernel with a publicly available SVM implementation • 4 methods • Mismatch Kernel • Fisher Kernel • SAM-T98 • PSI-BLAST Uses SVM implementation HMM Alignment Scoring
Peformance Measurement - ROC ROC • Show on board: • The closer to 1, the better the score – more true positives to false positives ROC50
Performance Comparison Many of the Mismatch SVM and Fisher Kernel classifications fall close to 1, meaning there is a low FP error rate; Both classifiers manage to classify almost all of the 33 classes with ROC score > 0.85 threshold Comparison of four homology detection methods
Mismatch VS Spectrum ROC ROC50 Mismatch kernel outperforms the Spectrum kernel
Mismatch VS Fisher ROC ROC50 No Significant Difference!
Discussion & Conclusion • What was it for? • Constructing kernel for homology detection • What was achieved? • A kernel that was equal in performance to the best known classifier but with a lower computational cost • Future Work • Since does not depend on generative model (unlike Fisher), can be easily used for other stuff, eg. Splice site prediction • Since it is computationally cheaper (ie. faster), can be used for practical biological purposes, eg. multiclass prediction