Understanding Measurement: The Essence of Units and Protocols in Quantitative Analysis
Measurement is foundational in quantifying various physical properties. It requires two key ingredients: a unit of measurement and a protocol for comparing the quantity to that unit. The unit serves as the standard reference, while the protocol, which may vary from simple physical methods to complex mathematical formulas, provides the procedure for measurement. This article explores these concepts using examples like measuring volume through a physical protocol and introducing Riemann sums, illustrating the evolution of measurement methods from tangible techniques to abstract mathematical approaches.

Understanding Measurement: The Essence of Units and Protocols in Quantitative Analysis
E N D
Presentation Transcript
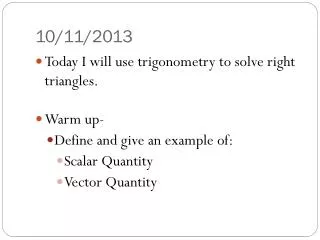
HOW DO WE MEASURE A QUANTITY ? Actually, what does it mean to measure some-thing, or more precisely, what are the ingredi-ents needed to be able to measure something? One ingredient should be obvious … A UNIT ! The second Ingredient is not so obvious, it is some kind of protocol (a Sunday word meaning procedure, method …) that allows us to “quantitatively compare” the quantity we want to measure to the unit we have chosen.
The “protocol” may be quite complex, or ingenious. Suppose we want to measure volume. The first thing we do is select a unit, here it is: This cube
And here is the quantity whose “volume” we want to measure What can we do? Physically it’s easy!
Use the unit cube to mark levels 1, 2, 3, 4 etc. on a cylindrical glass. • Fill the glass to a sufficiently high mark, then • Use the liquid in the glass to fill the thing whose volume you want to measure • Check the lower mark and you have the volume. If the thing you want to measure is solid, then … Any takers? Right, fill the glass to some mark, push the thing until submersed, read the new mark.
This was a rather physical (vs. mathematical) protocol, we will learn later how to replace it (for something as nice looking as this) with a mathematical protocol. Note in fact that, had the thing been this
We would already have a “protocol”, namely a … FORMULA ! Same thing for areas. For some kind of figures we have a protocol (all right, a formula!) that gives us a way to achieve a quantitative comparison between the figure and our unit of area, namely a square . We are simply going to devise a new protocol that will … • Work for some figures that the old protocol was not able to handle • Give the same answer as the old protocol for figures that the old protocol could handle.
The second property is important, if our new protocol doesn’t give for the area of a circle of radius we would not accept it as a reasonable extension of the notion of “area.” (The meaning of the word extension is that you have added something, but kept everything old) The new protocol we will devise is due to Georg Friedrich Bernhard Riemann and carries his name. It works for some (not all !) figures defined as: Let’s call them nice.
Convince yourself that all the old figures for which you have a formula (rectangle, triangle, trapezoid, circle) are nice. Here is a nice one not included among the old ones: almost, but not quite, a triangle.
Here is the protocol that Riemann devised: • Divide the interval into equal parts.(Note that each part has length ) • In each of the subintervals choose one - point essentially at random. • For each of the subintervals compute the area of that rectangle whose base is the subinterval, and height the functional value at the - point chosen.
Add up the areas of those rectangles (NOT easy !) • Take a limit as REMARKS. Steps D. and E. Will give us trouble, but we will actually find a way to “sidestep” them with a very powerful theorem. Step B. is a dream, it says we can pick any in the subinterval. Sometime you will be asked to pick the left end-point, sometime the right one. The figures I will show pick the highest rectangle, or the lowest, or an average. Let me show you.
Same curve as before: lowest rects Next
Same . highest rects average rects Here is what happens when
average rectangles Now we must invent notations and algorithms for this Riemann protocol ! It will come next.
We need to name: • The subintervals. Tradition requires that we name them thus: • The (common) length of each subinterval. Tradition requires that we name it thus: • The point we pick in each subinterval (there are of them !) Tradition requires that we name them thus: Now we can write The area of each of the sub-rectangles
The sum of the areas: or, more efficiently These are called the Riemann Sums for the function Computing Riemann sums is a challenge you will face in exams. Let’s do a couple.
We are going to verify that the Riemann protocol gives the expected answers for a rectangle and a triangle. Here we go: The rectangle.
This is SOOOO easy ! We have: • (no matter which you take.) QED Riemann protocol gives the old answer !
You do the triangle, OAB in the figure. The base is a , the height is k ,you should get .
The equation of the line is And you will need the formula Whose proof is shown below. _________________________________________ QED
One last example, this time of a figure for which the old protocol gives no answer, but the Riemann protocol does. The figure is shown below.
We will use the right end-points for our computations. We get: The corresponding Riemann sum is We need to know !
Nowadays this is easy, look it up on Wikipedia! You will find: Therefore our Riemann sum becomes Which is our answer
Challenge: Here is another curve. What does Riemann protocol give as an answer?