Download
1 / 29
290 likes | 412 Views
Observing users in the field. Lorrie Faith Cranor September 2009. Why observe users in the field?. Example of Design Failure. BART “Charge-a-Ticket” Machines allow riders to buy BART tickets or add fare takes ATM cards, credit cards, & cash. Example of Design Failure.

E N D
Observing users in the field Lorrie Faith Cranor September 2009
Example of Design Failure • BART “Charge-a-Ticket” Machines • allow riders to buy BART tickets or add fare • takes ATM cards, credit cards, & cash
Example of Design Failure • BART “Charge-a-Ticket” Machines • allow riders to buy BART tickets or add fare • takes ATM cards, credit cards, & cash • Problems (?) • no visual flow (Where do I start? Where do I go next?) • one “path” of operation • ticket type -> payment type -> payment -> ticket • BART Plus has minimum of $28, no indication of this until after inserting >= $1 • can’t switch to regular BART ticket • too many instructions • large dismiss transaction button does nothing
Lessons from the BART machine • Can’t we just define “good” interfaces? • “good” has to be taken in context of users • might be acceptable for office work, not for play • infinite variety of tasks and users • guidelines are too vague to be generative • e.g., “give adequate feedback” • How can we avoid similar results? • “What is required to perform the user’s tasks?”
Task Analysis • Find out: • who users are • what tasks they need to perform • Observe existing work practices • Create scenarios of actual use • This lets us try new ideas before building software! • Get rid of problems early in the design process while they are still cheap to fix!
Task Analysis Task Analysis Questions • Who is going to use the system? • What tasks do they now perform? • What tasks are desired? • How are the tasks learned? • Where are the tasks performed? • What’s the relationship between user & data?
Task Analysis Questions (cont.) • What other tools does the user have? • How do users communicate with each other? • How often are the tasks performed? • What are the time constraints on the tasks? • What happens when things go wrong?
Who? • Identity • in-house or specific customer is easy • need several prototypical users for broad product • Background • Skills • Work habits and preferences • Physical characteristics
Who (BART)? • Identity? • people who ride BART • business people, students, disabled, elderly, tourists • Background? • may have an ATM or credit card • have used other fare machines before • Skills? • may know how to put cards into ATM • know how to buy BART tickets
Who (BART cont.)? • Work habits and preferences? • Some people: use BART 5 days a week • Others: first time use • Physical characteristics? • varying heights -> don’t make it too high or too low!
What Tasks? • Important for both automation and new functionality • Understand relative importance of tasks • Example: on-line billing • small dentists office installed new billing system • assistants became unhappy with new system • old forms contained hand-written margin notes • e.g., patient A’s insurance takes longer than most
Where is the Task Performed? • Office, laboratory, point of sale? • Effects of environment on users? • Users under stress? • Confidentiality required? • Wet, dirty, or slippery hands? • Soft drinks? • Lighting? • Noise?
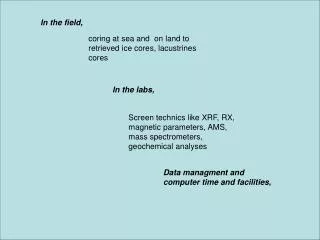
What Other Tools Does the User Have? • More than just compatibility • How user works with collection of tools to get things done • Example: automating lab data collection • how is data collected now? • by what instruments and manual procedures? • how is the information analyzed? • are the results transcribed for records or publication? • what media/forms are used and how are they handled?
How Often Do Users Perform the Tasks? • Frequent users remember more details • Infrequent users may need more help • even for simple operations • make these tasks possible to do • Which function is performed • most frequently? • by which users? • optimizing system for these tasks will improve perception of good performance
Involve Users to Answer Task Analysis Questions • Users help designers learn: • what they do and how they do it • Developers reveal technical capabilities • builds rapport and ideas of what is possible • users can comment on whether ideas make sense • How do we do this? • observe & interview prospective users in work place!
Design from Data • Heated arguments with others on design team • Over what tools, skills, and knowledge users have • These tend to generate lots of heat, little light • Go out to real users and get real data from them • find out what they really do • how would your system fit in • Are they too busy? • buy their time (t-shirts, coffee mugs) • find substitutes (medical students)
Can’t we just ask users what they want? • Not familiar with what is possible with technology • Not familiar with design constraints • Budget, legacy code, time, etc • Not familiar with good design • Not familiar with security and privacy • Sometimes users don’t know what they want • Ex. Remote controls • Contextual inquiry is an important method for understanding users’ needs • Also, attitude vs actual behavior
Contextual Inquiry • Go to the workplace & see the work as it unfolds • People summarize, but we want details • Keep it concrete when people start to abstract • “We usually get reports by email”, ask “Can I see one?”
Contextual Inquiry • Facts are only the starting point, you want a design based on correct interpretations • Validate & rephrase • share interpretations to check your reasoning • Ex. “So accountability means a paper trail?” • people will be uncomfortable until the phrasing is right
Conducting a Contextual Inquiry • Use recording technologies • notebooks, tape recorders, still & video cameras • Structure • conventional interview (15 minutes) • introduce focus & deal with ethical issues • get used to each other by getting summary data • transition (30 seconds) • state new rules – they work while you watch & interrupt • contextual interview (1-2 hours) • take notes, draw, be nosy! (“who was on the phone?”) • wrap-up (15 minutes) • summarize your notes & confirm what is important
Observation homework • http://cups.cs.cmu.edu/courses/ups-fa09/observations.html • Do this assignment with a partner, if possible. • Observe people in a public place using a computerized system. For example, you might observe people using a public transit ticket machine, a parking garage pay station, a hardware store self-checkout machine, a library self-checkout machine, or an airport self-check-in kiosk. Stay long enough to observe both experienced and inexperienced users using the system. • Alternatively, recruit a few people you know and observe them using a computer or computerized device (cell phone, microwave oven, etc.) to complete a task. Try to recruit someone who has used the device before and someone who has not. • What kinds of problems did people have using the system? What aspects of the system appeared to be easy to learn? What aspects of the system appeared to be difficult to learn? What aspects of the system seemed to frustrate experienced users? Most importantly, how might the design of the system be improved? • Write up a short report on your observations and recommendations to turn in. Include an appendix with photographs or sketches of key elements of the user interface you observed. The report should be 2-4 pages plus the appendix.
Diary studies • Participants asked to record a diary entry any time a certain type of event occurs, usually over a period of several days or weeks • Allows you to get their immediate response without recall • But they have to remember to do it
Experience sampling • Participants fill out questionaires in response to alerts so that they don’t have to recall, their responses are based on what is happening now • Often used to understand mood, time use, and social interactions • Need to find way to alert participants and have them respond to short survey (< 2 minutes) • Beepers, email, SMS, diaries, etc. • S. Consolvo and M. Walker. Using the Experience Sampling Method to Evaluate UbicompApplications.Pervasinve Computing, April-June 2003http://www.seattle.intel-research.net/pubs/final-ESM-pub-with-Walker.pdf
Paratyping • Measuring real-life experiences instead of testing the technology • Paratypes • a simulation, or model, of interaction (“-type”) with a technology which is evaluated alongside (“para-”) real-world experience • “proxies” act as substitutes for researcher • As they go about their daily life they survey the people they interact with Iachello, G., Truong, K. N., Abowd, G. D., Hayes, G. R., and Stevens, M. 2006. Prototyping and sampling experience to evaluate ubiquitous computing privacy in the real world. CHI2006.DOI= http://doi.acm.org/10.1145/1124772.1124923