Download
1 / 19
190 likes | 204 Views
This module provides a comprehensive analysis of the drivers of deforestation and forest degradation in the Democratic Republic of the Congo (DRC) and Indonesia. The module includes qualitative and quantitative assessments conducted by various organizations and covers direct and indirect drivers, as well as the relationship between direct activities and underlying causes. It also explores the possibility of linking different drivers to greenhouse gas emissions.

E N D
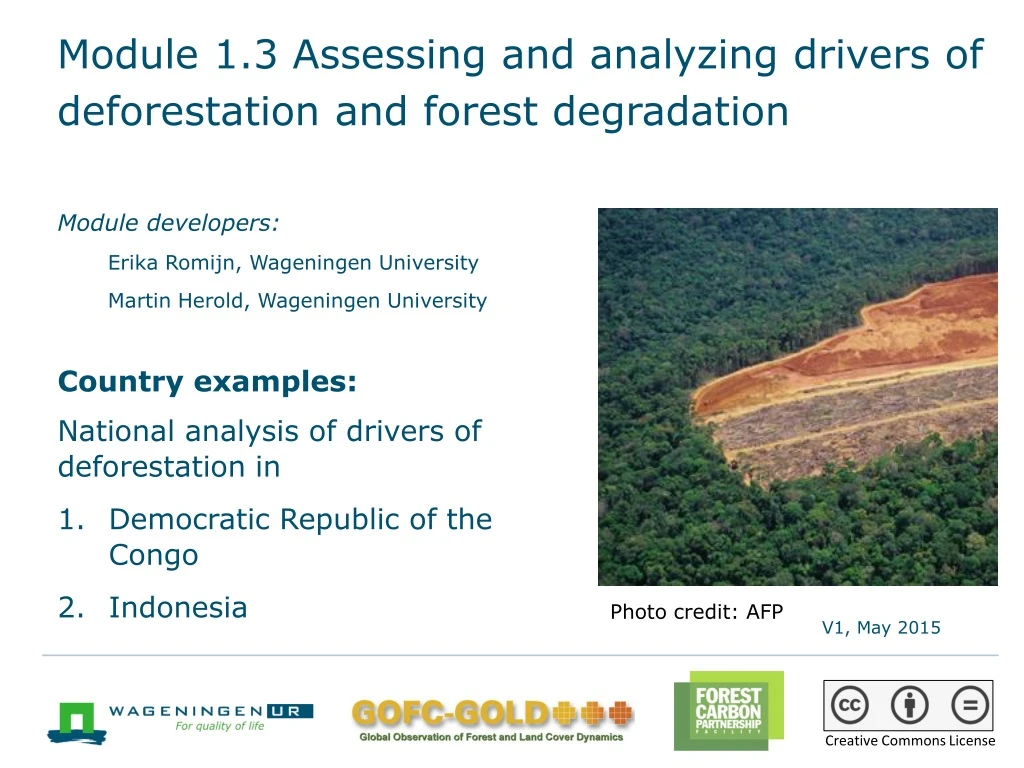
Module 1.3 Assessing and analyzing drivers of deforestation and forest degradation Module developers: Erika Romijn, Wageningen University Martin Herold, Wageningen University Country examples: National analysis of drivers of deforestation in • Democratic Republic of the Congo • Indonesia Photo credit: AFP V1, May 2015 Creative Commons License
1. Democratic Republic of the Congo (DRC): National analysis of drivers of deforestation DRC is actively participating in REDD+ and performed a national analysis of drivers of deforestation and forest degradation that included: • Qualitative assessments • By civil society • By UN Environment Programme (UNEP) • Quantitative assessment • By Université catholique de Louvain (UCL) • Synthesis of all studies
Qualitative analysis by civil society • Extensive literature review • Interviews with four to seven experts per province, to list the 10 most important direct and indirect drivers per province • Direct drivers consolidated at national level: • Slash-and-burn agriculture practiced by farmers • Local wood consumption • Charcoal and fuel wood / firewood • Indirect drivers consolidated at national level: • Population growth • Poverty of local population (farmers) • Administrative deficit
Qualitative analysis by UNEP • Selection of 40 deforestation sites: literature review, field observations, and interviews with experts and different actors • Direct drivers consolidated at national level: • Slash-and-burn agriculture • Charcoal production • Causes related to demographics and phenomena such as wildfire • Indirect drivers consolidated at national level: • Population fluctuation • Institutional aspects (successive wars) • Economic aspects (poverty, youth employment)
Quantitative study on the relation between direct activities and explanatory variables • Object-based segmentation combined with nonsupervised classification of Landsat satellite images produced land cover maps for 1990, 2000, and 2005 • Analysis of land cover changes for 1990–2000 and 2000–2005 • Thirty-five explanatory variables were grouped into eight categories of underlying causes: infrastructure, agriculture, forest exploitation, economic factors, transport axes, demographic factors, sociopolitical factors, and biophysical factors
Quantitative study on the relation between direct activities and explanatory variables • Linking land-cover changes (deforestation and degradation) to explanatory factors: • Univariate statistical analysis to quantify the influence of the different explanatory variables during the two different time periods: 1990–2000 and 2000–2005 • Multivariate statistical analysis to create explanatory models for combinations of underlying causes of deforestation
Direct drivers, explanatory factors, and underlying causes of deforestation
2. Indonesia: Drivers of deforestation analysis using national data • How to derive quantitative driverinformation based on land cover maps?
Land-cover classification • Using the FAO forest definition: • Forest > 0.5 ha • Tree canopy cover > 10% • Tree height > 5m • forest being the predominant land use in the area
Step 2. Map deforestation areas for subsequent time periods • Forest, defined following the FAO forest definition • Deforestation, degradation, reforestation/regeneration: DegradedForest Primary Forest degradation Forest deforestation reforestation/regeneration deforestation NonforestClasses Nonforest
Deforestation and forest degradation in Indonesia between 2000 and 2009
Step 3. Link deforested areas to postforest land use Mapping direct drivers: land cover following deforestation
Drivers of deforestation 2000–2009:Postforest land use per the FAO forest definition
Step 4. Quantify the different drivers of deforestation (for the time period 2000–2009) Distribution of different drivers in terms of area change Source: MOFOR 2011.
Step 5. Possibility of linking different drivers to GHG emissions • Reporting of carbon and other GHG emissions for each driver is encouraged • Following information required: • Carbon density (emission factor) for each different forest type, to quantify total emissions (= area of deforestation X emission factor) (See modules 2.3 and 2.5.) • Additional emissions related to specific drivers,these may occur after the deforestation and depend on the type of driver
Recommended modules as follow up • Module 2.1 to proceed with REDD+ measuring and monitoring and focus on monitoring activity data for forests using remote sensing • Modules 3.1 to 3.3 to learn more about REDD+ assessment and reporting
References • Defourny, P., C. Delhage, J-P. KibambeLubamba. 2011. Analyse quantitative des causes de la deforestation et de la degradation des forets en République Démocratique du Congo. Kinshasa: FAO-RDC Coordination nationale REDD N°UNJP/DRC /041/01/2009. http://www.un-redd.org/Newsletter35/DRC_Drivers_of_Deforestation/tabid/105802/Default.aspx. • Mahonghol, Denis. 2012. Analyse qualitative des causes et agents de la déforestation et de la dégradation des terres forestières dans une RDC post-conflit. Evaluation environnementale post-conflict (EEPC). Kinshasa : Division Post-Conflit et Gestion des Désastres Programme Pays de la RDC. http://www.un-redd.org/Newsletter35/DRC_Drivers_of_Deforestation/tabid/105802/Default.aspx. • MECNT (Ministère de l’Environnement, Conservation de la Nature et Tourisme). 2012a. Étude qualitative sur les causes de la déforestation et de la dégradation des forêts en République Démocratique du Congo. Kinshasa: Groupe de Travail Climat REDD. http://www.un-redd.org/Newsletter35/DRC_Drivers_of_Deforestation/tabid/105802/Default.aspx. • MECNT. 2012b. Synthèse des études sur les causes de la déforestation et de la dégradation des forêts en République Démocratique du Congo. Kinshasa. http://www.un-redd.org/Newsletter35/DRC_Drivers_of_Deforestation/tabid/105802/Default.aspx.
Ministry of Forestry (MOFOR), 2011. Digital Land Cover Map 2009. Ministry of Forestry, Jakarta, Indonesia (unpublished). • Romijn E., J. H. Ainembabazi, A. Wijaya, M. Herold, A. Angelsen, L. Verchot, and D. Murdiyarso. 2013. “Exploring Different Forest Definitions and Their Impact on developing REDD+ Reference Emission Levels: A Case Study for Indonesia. Environmental Science and Policy 33: 246–259.