Optimizing Deleveraging Profile: Net Debt/EBITDA Analysis
20 likes | 54 Views
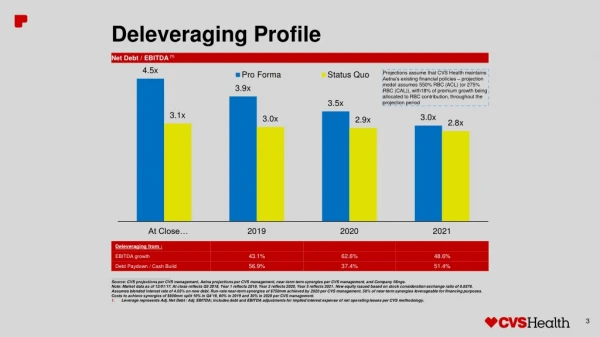
Dive into the strategic framework for deleveraging through a comprehensive examination of net debt to EBITDA ratio, leveraging synergies, and financial projections provided by CVS and Aetna. Explore how the projected equity issuance, interest rates, and cost allocation for synergies impact the company's leverage position over a three-year period.

Optimizing Deleveraging Profile: Net Debt/EBITDA Analysis
E N D
Presentation Transcript
Deleveraging Profile Net Debt / EBITDA (1) ___________________________ Source: CVS projections per CVS management, Aetna projections per CVS management, near-term term synergies per CVS management, and Company filings. Note: Market data as of 12/01/17. At close reflects Q3 2018, Year 1 reflects 2019, Year 2 reflects 2020, Year 3 reflects 2021. New equity issued based on stock consideration exchange ratio of 0.8378. Assumes blended interest rate of 4.03% on new debt. Run-rate near-term synergies of $750mm achieved by 2020 per CVS management. 50% of near-term synergies leverageable for financing purposes. Costs to achieve synergies of $600mm split 10% in Q4’18, 60% in 2019 and 30% in 2020 per CVS management. Leverage represents Adj. Net Debt / Adj. EBITDA; includes debt and EBITDA adjustments for implied interest expense of net operating leases per CVS methodology. Projections assume that CVS Health maintains Aetna’s existing financial policies – projection model assumes 550% RBC (ACL) (or 275% RBC (CAL)), with18% of premium growth being allocated to RBC contribution, throughout the projection period
Deleveraging Profile Net Debt / EBITDA (1) ___________________________ Source: CVS projections per CVS management, Aetna projections per CVS management, near-term term synergies per CVS management, and Company filings. Note: Market data as of 12/01/17. At close reflects Q3 2018, Year 1 reflects 2019, Year 2 reflects 2020, Year 3 reflects 2021. New equity issued based on stock consideration exchange ratio of 0.8378. Assumes blended interest rate of 4.03% on new debt. Run-rate near-term synergies of $750mm achieved by 2020 per CVS management. 50% of near-term synergies leverageable for financing purposes. Costs to achieve synergies of $600mm split 10% in Q4’18, 60% in 2019 and 30% in 2020 per CVS management. Leverage represents Adj. Net Debt / Adj. EBITDA; includes debt and EBITDA adjustments for implied interest expense of net operating leases per CVS methodology. Projections assume that CVS Health maintains Aetna’s existing financial policies – projection model assumes 550% RBC (ACL) (or 275% RBC (CAL)), with18% of premium growth being allocated to RBC contribution, throughout the projection period