Fixed-Income Securities
470 likes | 683 Views
Fixed-Income Securities. Timothy R. Mayes, Ph.D. FIN 3600: Chapter 9. What is a Bond?. A bond is a tradable instrument that represents a debt owed to the owner by the issuer. Most commonly, bonds pay interest periodically (usually semiannually) and then return the principal at maturity.

Fixed-Income Securities
E N D
Presentation Transcript
Fixed-Income Securities Timothy R. Mayes, Ph.D. FIN 3600: Chapter 9
What is a Bond? • A bond is a tradable instrument that represents a debt owed to the owner by the issuer. Most commonly, bonds pay interest periodically (usually semiannually) and then return the principal at maturity.
Advantages of Bonds over Stocks • Bonds, while a more conservative investment than stocks, can offer certain investors some very attractive features: • Safety • Reliable income • Potential for capital gains • Diversification (especially for an otherwise all-equity portfolio) • Tax advantages
Safety of Bonds • The safety of bonds derives mainly from two things: • Bondholders are in line ahead of both preferred and common stockholders for payment. Thus, if a firm falls on hard times, it must first pay its bondholders while stockholders may see dividends cut. • In the event that a company skips a payment or violates covenants of the indenture, the creditors may force it into bankruptcy to protect the value of their investment. Stockholders have no such right.
Reliability of Income • Most bonds are “fixed-income” securities. As such, they promise a fixed set of interest payments and the return of the principal at maturity. • Investors can count on receiving their interest payments in full and on time, except in the event of severe financial distress. Common stockholders can never be sure of the exact amount (and sometimes the exact timing) of dividends. • Bonds that are callable (most corporates and some Treasuries issued before 1985) do not offer as much reliability, though it is still far better than stocks. As interest rates decline, the probability of a call increases.
Potential for Capital Gains • Investors who do not hold a bond to maturity may enjoy capital gains or suffer capital losses: • When interest rates fall, bond prices rise. Thus an investor who buys when rates are high, and sells after rates fall will earn a capital gain. The rate decrease may be due to general market conditions or improvement in the company’s creditworthiness. • When interest rates rise, bond prices fall. Thus an investor who buys when rates are low, and sells after rates rise will suffer a capital loss. The rate increase may be due to general market conditions or a decrease in the company’s creditworthiness. • All other things being equal, as the bond moves through time to maturity, the price must move towards its face value. Thus, bonds purchased at a discount will rise in price, and those purchased at a premium will decline in price.
Diversification • Bonds, when added to an equity portfolio, can lower risk while lowering returns slightly (depending on the percentage of the portfolio allocated to bonds). • While bond prices may be quite volatile, due to the stability of the income that they provide bond total returns tend to have low correlation with stock returns. • The following slide shows the effect of adding bonds to a stock portfolio.
Diversification (cont.) • The table below shows stock (S&P 500) and bond (VBIIX) returns from 1994 to 2000. Note that as we increase exposure to bonds the return drops, but not as quickly as the risk (standard deviation).
Tax Advantages of Bonds • Some bonds are tax-advantaged: • Municipal bond income is free from federal income taxes, and state income taxes in the state in which they were issued. • Income from U.S. Treasury issues are free from state and local income taxes. • Income from Savings Bonds (Series EE and I) is free from state and local income taxes, and federal income taxes on I Bonds may be deferred for up to 30 years. Federal taxation may be completely or partially eliminates when used for education. • Note that the above tax benefits are for income (interest payments) only. Any capital gains are fully taxable at the local, state, and federal levels.
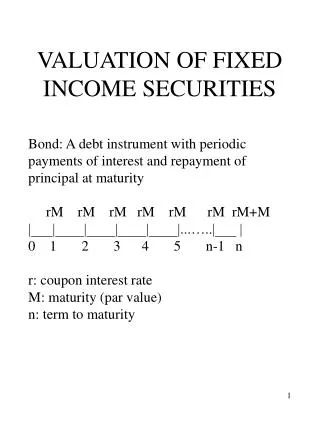
Basic Bond Valuation • The intrinsic value of a bond, like stocks, is the present value of its future cash flows. • Bonds, however, have much more predictable cash flows and a finite life. • The cash flows promised by a bond are: • A series of (usually) constant interest payments • The return of the face value of the bond at maturity
Basic Bond Valuation (cont.) • The value of a bond is determined by four variables: • The Coupon Rate – This is the promised annual rate of interest. It is normally fixed at issuance for the life of the bond. To determine the annual interest payment, multiply the coupon rate by the face value of the bond. Interest is normally paid semiannually, and the semiannual payment is one-half the annual total payment. • The Face Value – This is nominally the amount of the loan to the issuer. It is to be paid back at maturity. • Term to Maturity – This is the remaining life of the bond, and is determined by today’s date and the maturity date. Do not confuse this with the “original” maturity which was the life of the bond at issuance. • Yield to Maturity – This is the rate of return that will be earned on the bond if it is purchased at the current market price, held to maturity, and if all of the remaining coupons are reinvested at this same rate. This is the IRR of the bond.
1000 50 50 50 50 50 50 0 1 2 3 4 5 6 Basic Bond Valuation Example • Suppose that you are interested in purchasing a 3-year bond with a 10% semiannual coupon rate and a face value of $1,000. If your required return is 7%, what is the intrinsic value of this bond? • Here is a timeline showing the cash flows:
Basic Bond Valuation Example (cont.) • Note that the cash flows of the bond consist of: • An annuity, the interest payments, paid every six months. This is calculated as: • A lump sum which is the return of the face value of the bond at the end of its life. This payment is made at the same time as the last interest payment.
Basic Bond Valuation Example (cont.) • We can find the intrinsic value of these cash flows by finding the present value of the interest payments and then adding the present value of the face value: • Note that the first term is the present value of an annuity, and the second is the present value of a lump sum • Do the math, and you’ll find that the bond is worth $1,079.93. Note that this value must decline until it reaches $1,000 at maturity.
Bond Valuation Notes • A few things of note with regard to the example: • The interest is paid semiannually, so we first calculated the annual interest and the divided it by two. If interest was paid, say, quarterly, we would have divided the annual amount by four. • Similarly, we must convert the number of years to maturity (3) into the total number of periods (6). • Finally, we also must adjust your annual required return (7%) to a semiannual return (3.5%). • These three variables must always be stated on a per period basis. • Nearly all bonds (in the U.S.) pay interest more often than annually. Most often this is semiannually, but it could also be quarterly or monthly.
Valuing Bonds Between Coupon Dates • The bond valuation formula just presented has one major flaw: It only works on a coupon date. • Since coupon dates (interest payment dates) usually only occur twice per year, chances are (~ 99.45%) you’ll buy (or sell) a bond between coupon dates. • In this case, we must deal with accrued interest, and the increase in the bond value since the last coupon date.
Valuing Bonds Between Coupon Dates (cont.) • Imagine that we are halfway between coupon dates. We know how to value the bond as of the previous (or next even) coupon date, but what about accrued interest? • Accrued interest is assumed to be earned equally throughout the period, so that if we bought the bond today, we’d have to pay the seller one-half of the period’s interest. • Bonds are generally quoted “flat,” that is, without the accrued interest. So, the total price you’ll pay is the quoted price plus the accrued interest (unless the bond is in default, in which case you do not pay accrued interest, but you will receive the interest if it is ever paid).
Valuing Bonds Between Coupon Dates (cont.) • The procedure for determining the quoted price of the bonds is: • Value the bond as of the last payment date. • Take that value forward to the current point in time. This is the total price that you will actually pay. • To get the quoted price, subtract the accrued interest. • We can also start by valuing the bond as of the next coupon date, and then discount that value for the fraction of the period remaining.
Valuing Bonds Between Coupon Dates (cont.) • Let’s return to our original example (3 years, semiannual payments of $50, and a required return of 7% per year). • As of period 0 (today), the bond is worth $1,079.93. As of next period (with only 5 remaining payments) the bond will be worth $1,067.73. Note that: • So, if we take the period zero value forward one period, you will get the value of the bond at the next period including the interest earned over the period. P1 P0 Interest earned
Valuing Bonds Between Coupon Dates (cont.) • Now, suppose that only half of the period has gone by. If we use the same logic, the total price of the bond (including accrued interest) is: • Now, to get the quoted price we merely subtract the accrued interest: • If you bought the bond, you’d get quoted $1,073.66 but you’d also have to pay $25 in accrued interest for a total of $1,098.66.
Bond Return Measures • There are three ways in which the expected return of the bond is reported: • Current Yield (CY) • Yield to Maturity (YTM) • Yield to Call (YTC) • The current yield is simple, but inaccurate. The yield to maturity (or yield to call) is much more representative of the return you will receive, but suffers from a problem of its own.
The Current Yield • The current yield on a bond is simply the annual interest payment divided by its current price. • For our example bond, the current yield is: • Note that the current yield is ignoring the capital loss that you will suffer over the remaining life of the bond (it must sell for $1,000 at maturity), so it overstates the expected return for bonds selling at a premium. For discount bonds, the expected return is understated.
The Yield to Maturity • The yield to maturity gives the exact return that you will actually earn under the following conditions: • You purchase the bond at today’s price • You hold the bond to maturity • You reinvest all interest payments at the same YTM • The last condition is the most difficult to achieve with interest rates changing all the time. So, YTM is just an estimate of your actual return. • However, the YTM does take into account the increase or decrease in the price of the bond (capital gain or loss) over the life of the bond.
The Yield to Maturity (cont.) • Suppose that we didn’t know that our required return was 7% per year, but we did know that the current bond price was $1079.93. • We could solve for the yield implied by that price (i.e., the YTM). • Unfortunately, there is no closed-form solution to the bond valuation equation, so we need to use a trial and error algorithm to find the yield.
The Yield to Maturity (cont.) • Here is the bond valuation equation, slightly restated to make the point: • Note that I have replaced the bond’s intrinsic value (VB) with its price (PB), and its required return (kd) with its yield (YTM). • Our problem now is to solve for that YTM given the price.
The Yield to Maturity (cont.) • To find the YTM, we first make a guess at the yield. Say that we choose 10%. That gives us a price of $1,000 which is lower than the actual price. To get the price to go up, we must lower our estimated yield. • Suppose we now try 5%. The price now is $1,137.70 which is too high. We need to try a higher estimated yield. • Now, we know that the YTM must be between 5% and 10%, so let’s “split the difference” and try 7.5%. We get $1,066.06. Close, but not close enough. • We now know the YTM is between 5% and 7.5%, so choose 5.75%. We get $1,115.59. We now know the answer is between 5.75% and 7.5%. • Next, try 6.625%. We get $1,090.48. • And so on. Keep splitting the difference until you arrive at the correct price. The yield that achieves this is the YTM. • This is the type of process that your calculator goes through when solving for the YTM (the “i” key). Eventually, you will find that the actual yield is 7%.
The Yield to Call • The yield to call (YTC) is exactly the same as the YTM, except that it assumes that the bond will be called at the next call date. • The only differences from calculating the YTM are: • We need to change the number of periods until maturity to the number of periods until it can be called. • If a “call premium” is to be received, we must add that premium to the face value of the bond.
Risks of Bonds • Bonds are generally less risky than stocks, but they do suffer from several types of risk: • Credit risk – Risk of default. (See ratings on next slide) • Price risk – Risk of unexpected changes in rates, causing a capital loss. • Reinvestment risk – Risk that rates will fall and you will reinvest at a lower rate. • Purchasing power risk – Risk that inflation will be higher than expected. • Call risk – Risk that the bond will be called because of lower rates. • Liquidity risk – The risk that you will not be able to sell the bond at a price near its full value. • Foreign exchange risk – Risk that a foreign currency will decline in value, causing a decline in the value of your interest payments and principal.
Bond Ratings • Credit risk is the most important source of risk for owners of bonds. As a result, various rating agencies (S&P, Moody’s, Fitch, and Dominion Bond) assign grades to indicate the credit quality of various bond issues. These ratings are similar to those provided for insurance companies by A.M. Best. • As you should guess, yields on lower rated bonds will be higher (more risk) than those on higher rated bonds (less risk). • Bond ratings are a lot like grades: The agencies give A’s, B’s, C’s, and D’s with various schemes to differentiate within the category (i.e., AAA is better than AA).
Bond Ratings (cont.) • Note from this and the next slide, that there is virtually no risk of default within 1 year, and very little over longer periods, if you invest in investment grade securities. • One you go below investment grade, however, the risk of default rises dramatically.
Corp. Bond Spreads Over Treasuries • This table demonstrates that bond yields (spreads over equivalent Treasuries) increase as credit ratings decline. • Note also that the spreads widen as maturity increases.
Malkiel’s Bond Pricing Theorems • In 1961, Burton Malkiel published a paper where he proved five important bond pricing theorems: • Bond prices move inversely to interest rates • Longer maturity bonds respond more strongly to a given change in interest rates • Price sensitivity increases with maturity at a decreasing rate • Lower coupon bonds respond more strongly to a given change in interest rates • Price changes are greater when rates fall than they are when rates rise (asymmetry in price changes)
Duration • Two of Malkiel’s theorems relate directly to bond price volatility. • He showed that the longer the term to maturity, the greater the change in price, but the coupon rate also affects volatility (lower coupons = more volatility). • These same observations led Frederick Macaulay to look for a better measure of volatility than just the term to maturity. In 1938, he discovered duration which combines maturity and coupon rate to describe a bond’s price volatility.
Duration (cont.) • Suppose that we have two bonds, identical except for their term to maturity. Both bonds have coupon rates of 10% paid annually (for simplicity), and face values of $1,000. Your required return is 10%. Bond 1 has 5 years to maturity while Bond 2 has 10 years to maturity. • The price of each bond is $1,000 (do the math). • Now, if your required return drops to 8%, which bond will increase the most in value? • Bond 1 will be worth $1,079.85, and Bond 2 will be worth $1,134.20 • Bond 2 wins because of its longer maturity (see Malkiel’s theorem 2). • Note that had rates risen instead, then Bond 1 would lose less than Bond 2 so Bond 1 would be favored.
Duration (cont.) • Now, suppose that our bonds both have 5 years to maturity, but Bond 3 has a coupon rate of 7% and Bond 4 has a coupon rate of 10%. • With your required return at 10%, Bond 3 is worth $886.28, and Bond 4 is worth $1,000 (do the math). • If your required return drops to 8%, which bond will increase more in value? • Bond 3 will be worth $960.73 (an increase of 8.40%), and Bond 4 will be worth $1,079.85 (an increase of 7.99%). • So Bond 3, with the lower coupon rate wins (see Malkiel’s theorem 4).
Duration (cont.) • Finally, what if Bond 5 has a maturity of 5 years and a 5% coupon, while Bond 6 has a maturity of 10 years and a 10% coupon? • Now we have a conflict. Bond 5 has a lower coupon rate, but Bond 6 has a longer maturity. How do we know which one will change more in price when rates drop to 8%? • First, note that at 10% Bond 5 is worth $810.46 and Bond 6 is worth $1,000. • At 8%, Bond 5 is worth $880.22 (an 8.6% increase), and Bond 6 is worth $1,134.20 (and increase of 13.42%). • Bond 6 wins because it has a longer duration.
Calculating Duration • Duration is a measure of the effective life of the bond. It is a weighted-average term to maturity where the weights are the present values of the cash flows: • Where DMac is the Macaulay duration, CFt is the cash flow in period t, and P0 is the current price of the bond.
Calculating Duration (cont.) • Let’s calculate the durations of Bond 5 and Bond 6 from the last example, using a 10% required return: • So, Bond 5 has a duration of 4.49 years. Similar calculations will show that Bond 6 has a duration of 6.76 years. • The longer duration is the reason that Bond 6 outperformed Bond 5 when rates fell to 8%.
Properties of Duration • A longer term to maturity increases duration, all other things being equal. However, duration increases with term to maturity at a decreasing rate. • For coupon-bearing bonds, duration is always less than term to maturity. For zero-coupon bonds it is exactly the same as term to maturity. • Lower coupon rates lead to longer durations, all other things being equal. • Higher yields lead to shorter durations. • When calculating duration for semiannual bonds, the resulting duration will be in semiannual periods. You must adjust this back to annual by dividing by 2.
The Use of Macaulay Duration • Macaulay duration is a very useful tool in bond portfolio management: • When interest rates are expected to move, a portfolio manager should change the duration of the portfolio to take maximum advantage (or limit damage) of the change. • Also, by using an “immunization” strategy, we can eliminate both price risk and reinvestment risk to guarantee a certain amount of funds will be available to meet needs on a certain future date.
Modified Duration • Macaulay duration is a poor predictor of the percentage change in a bond’s price when its yield changes. We can improve this approximation by calculating the modified duration: • Bond 5 has a modified duration of:
Modified Duration (cont.) • Bond 6 has a modified duration of 6.14 years. • Note that we can calculate the approximate percentage change in price of a bond as: • So, when rates drop by 2%, we would find that Bond 5 should change by approximately:
Modified Duration (cont.) • Let’s compare the approximations to the actual changes: • Bond 5: Actual = 8.6%, Approximate = 8.16% • Bond 6: Actual = 13.42%, Approximate = 12.29% • Why were the approximations so far off? • Mainly because of the huge (200bp) decline in rates. Duration is technically only correct for very small changes in rates. • The relationship between price and yield is non-linear, but duration measures linear changes. • If we used only a small change in rates (say, 0.1% or 1bp) we would be much closer. • If we took account of the non-linear relationship (known as convexity which is beyond the scope of this class) we would get closer still. • Note though, that the modified duration correctly tells us that Bond 6 will increase in value significantly more than Bond 5. This is really the important result.