Download
1 / 59
590 likes | 736 Views
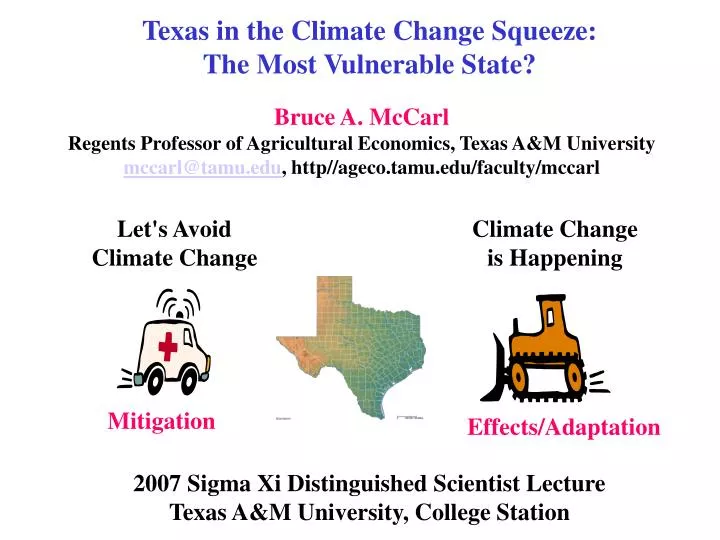
Texas in the Climate Change Squeeze: The Most Vulnerable State?. Bruce A. McCarl Regents Professor of Agricultural Economics, Texas A&M University mccarl@tamu.edu , http//ageco.tamu.edu/faculty/mccarl. Let's Avoid Climate Change. Climate Change is Happening. Mitigation.

E N D
Texas in the Climate Change Squeeze: The Most Vulnerable State? Bruce A. McCarl Regents Professor of Agricultural Economics, Texas A&M University mccarl@tamu.edu, http//ageco.tamu.edu/faculty/mccarl Let's Avoid Climate Change Climate Change is Happening Mitigation Effects/Adaptation 2007 Sigma Xi Distinguished Scientist Lecture Texas A&M University, College Station
Why an Economist on climate change? Poses some large economic issues Why is climate change happening? Partially due to unpriced externality Emitters do not consider emission damages What will it do to society welfare? Altered production particularly in ag and forest Altered ecology Altered energy costs What can we do to mitigate or adapt and at what cost? US Government said Kyoto compliance too costly Adaptation can be disruptive
Plan of Presentation Degree of climate change What is happening up to now, What is projected Why is this happening Effects of climate change Sample findings on agriculture and forest plus Ecology How might we mitigate Ag and forestry roles and Renewable energy How about adaptations Why and what can it accomplish All too short but a flavor beyond the news, Al Gore and Rush Limbaugh
Degree of climate change What is happening up to now – Temperature since 1979 Rates of change accelerating as time progresses (colored lines) Texas in a relatively rapidly warming area within continental US http://ipcc-wg1.ucar.edu/wg1/Figures/AR4WG1_Ch03-Figs_2007-10-23.ppt#299,43,FAQ 3.1, Figure 1
Degree of climate change What is happening up to now – Temperature since 1979 Texas in a relatively rapidly warming area within continental US http://ipcc-wg1.ucar.edu/wg1/Figures/AR4WG1_Ch03-Figs_2007-10-23.ppt#299,43,FAQ 3.1, Figure 1
Degree of climate change What is happening up to now – Ocean Temperature Ocean also shows temperature increase Source : Intergovernmental Panel on Climate Change. IPCC Fourth Assessment Report WGI http://ipcc-wg1.ucar.edu/
Degree of climate change What is happening up to now – Land Figure TS.20. (Top) Records of Northern Hemisphere temperature variation during the last 1300 years with 12 reconstructions using multiple climate proxy records shown in colour and instrumental records shown in black. (Middle and Bottom) Locations of temperature-sensitive proxy records with data back to AD 1000 and AD 1500 (tree rings: brown triangles; boreholes: black circles; ice core/ice boreholes: blue stars; other records including low-resolution records: purple squares). Data sources are given in Table 6.1, Figure 6.10 and are discussed in Chapter 6. {Figures 6.10 and 6.11} Figure TS.20 Source : Intergovernmental Panel on Climate Change. IPCC Fourth Assessment Report WGI http://ipcc-wg1.ucar.edu/
Degree of climate change What is happening up to now – Potential Precipitation Rainfall is increasing
Degree of climate change What is happening up to now -- Precipitation Texas has areas that had largest decrease in continental US http://ipcc-wg1.ucar.edu/wg1/Figures/AR4WG1_Ch03-Figs_2007-10-23.ppt#269,14,Figure 3.13
Degree of climate change What is happening up to now -- Precipitation • Rainfall became more concentrated and Texas again has such areas http://ipcc-wg1.ucar.edu/wg1/Figures/AR4WG1_Ch03-Figs_2007-10-23.ppt#296,40,Figure 3.39
Degree of climate change What is happening up to now -- Drought Palmer drought index change 1900-2002, Regional map and graph of global average Texas shows lesser index Did not graph last 20 years http://ipcc-wg1.ucar.edu/wg1/Figures/AR4WG1_Ch03-Figs_2007-10-23.ppt#300,44,FAQ 3.2, Figure 1
Observed Changes in Oceans, Snow and other items
Degree of climate change What is happening up to now -- Other Source : Intergovernmental Panel on Climate Change. IPCC Fourth Assessment Report WGI http://ipcc-wg1.ucar.edu/
Degree of climate change What is happening up to now – Hurricanes Figure TS.11. Tropical Atlantic (10°N–20°N) sea surface temperature annual anomalies (°C) in the region of Atlantic hurricane formation, relative to the 1961 to 1990 mean. {Figure 3.33} Source : Intergovernmental Panel on Climate Change. IPCC Fourth Assessment Report WGI http://ipcc-wg1.ucar.edu/
Degree of climate change What is happening up to now -- Other Available observational evidence indicates that regional changes in climate, particularly increases in temperature, have already affected a diverse set of physical and biological systems in many parts of the world. Observed changes include Shrinkage of glaciers and sea ice Snow cover has decreased Thawing of permafrost, Later freezing and earlier break-up of ice on lakes/rivers Lengthening of mid- to high-latitude growing seasons Poleward and altitudinal shifts of plant and animal ranges, Declines of some plant and animal populations, Earlier flowering of trees, emergence of insects, and egg-laying in birds Global average sea level has risen and ocean heat content has increased
Degree of climate change Why is this happening IPCC (1995) “The balance of evidence suggests a discernible human influence on global climate.” IPCC (2001) “Most of the warming of the past 50 years is likely (>66%) to be attributable to human activities.” IPCC (2007) ”Most of the observed increase in global average temperatures since the mid-20th century is very likely (>90%) due to the observed increase in anthropogenic (human emission caused)greenhouse gas concentrations.”
Degree of climate change Why is this happening Some gases, like carbon dioxide (CO), trap heat in the atmosphere by absorbing longwave radiation while letting the Sun's energy pass through. The transparent roof and walls of a greenhouse allow in the sunlight while keeping in the heat. Since these gases act similarly in the atmosphere, we call them greenhouse gases. Source : U.S. National Assessment/ http://www.usgcrp.gov/usgcrp/Library/nationalassessment/images/Greenhouse-s.jpg.
Degree of climate change Why is this happening • Pre industrial - 275 Counting Non CO2 • - 345 this is increase almost doubles • 2007 - 380+ http://www.esrl.noaa.gov/gmd/ccgg/trends/co2_data_mlo.html
Degree of climate change - Why is this happening CO2 and temperature linked but does not lead http://www.whrc.org/resources/online_publications/warming_earth/scientific_evidence.htm
Degree of climate change – Texas and GHGs 2003 State by State Energy related CO2 emissions -- Texas wins Emissions growing Most emissions from energy US EPA, http://www.eia.doe.gov/environment.html US EIA, http://www.eia.doe.gov/environment.html
Degree of climate change – Source of GHGs Energy emissions largely petroleum and coal
Degree of climate change - What is projected Climate models predict increasing emissions will cause a temp increase Source : IPCC AR4t
Degree of climate change - What is projected • Less water Texas in relatively severely affected area
Degree of climate change - What is projected • Very likely that heat waves will be more intense, more frequent and longer lasting • Precipitation generally increases but with general decreases in the subtropics • Precipitation intensity is projected to increase but there would be longer periods between rainfall events. • Tendency for drying of mid-continent during summer, indicating a greater risk of droughts in those regions. • Sea level projected to rise 1999 and 2099 by 0.18 to 0.59 m. • Likely increase in hurricane peak wind intensities - an increase in the numbers of the most intense. • Fewer mid-latitude storms- poleward shift of storm tracks • Atlantic Ocean Meridional Overturning Circulation (MOC) – Gulf Stream will slow down
Texas is quite vulnerable Current developments are disruptive of some activities Projections on water, temperature, severe weather and hurricanes are worrisome for agriculture and other sectors. Sea level also Possibility of Mitigating emissions will influence electricity generation and petroleum industries that are large in state
What can be done Wait for more information –do little and live with it Plan to adapt Try to reduce future change Mitigate emissions
Implications of living With a changed climate
Live with it - Agriculture Table 2 National crop sensitivity over all crops giving average yield change in percent to 2030 -- GCM behind Climate Scenario -- Hadley Canadian CSIRO REGCM Corn Belt 24.02 18.23 6.05 6.58 Great Plains 25.29 17.28 3.67 4.82Lake States 43.75 53.03 9.34 11.84 Northeast 9.48-2.072.13 4.45Rocky Mountains 27.74 19.37 18.27 15.04 Pacific Southwest 17.76 21.44 15.58 15.05 Pacific Northwest 65.42 17.01 17.22 18.30 South Central 13.25-6.06 -0.71 -0.79Southeast 10.00 -3.16 3.84 2.40South West 21.66 14.69 3.38 2.60National 25.14 16.51 6.02 6.46Red signifies results below mean Source McCarl work for US National Assessment http://agecon2.tamu.edu/people/faculty/mccarl-bruce/papers/778.pdf
Live with it - Agriculture Table 8 Annual consumer and producer welfare changes for 2030 climate, with adaption (million of dollars) GCM scenario name Canadian Hadley REGCM CSIRO United States Consumers Change 3005 9894 1347 1043 Producers Change 1494 -4262 -1002 -866 Percent 4.68% -13.34% -3.14% -2.71% Total Change 4499 5632 345 177 Rest of the World Consumers Change 2527 4761 398 143 Producers Change -763 -2264 -251 -15 Total Change 1764 2498 147 127 Overall Gain largely goes to Consumers Source McCarl work for US National Assessment http://agecon2.tamu.edu/people/faculty/mccarl-bruce/papers/778.pdf
Live with it - Agriculture • Consistent losses in the Corn Belt, South Central and Southeast • Mixed but largely negative results in the Southwest. There up to 40% less cropped land • McCarl, B.A., W.D. Rosenthal, C.C. Chang, and R.M. Adams, "Climate Change and Texas Agriculture," in Implications of Climate Change on Texas, Edited by G.R. North, J. Schmandt and J. Clarkson, Chapter 8 University of Texas Press, 1994. • McCarl, B.A., "Agricultural Sensitivity to Climatic Change," in The Changing Climate of Texas: Predictability and Implications for the Future, Chapter 15, 179-198, 1995. • Positive results in the Pacific Northwest • Mixed but mostly positive results in the Great Plains, Northeast, Pacific Southwest • Mixed results in the Lake States, and the Rocky Mountains.
Live with it – Ecology, Ag, M&I, Water A Study of the Effects of Climatic Change on the Texas Edwards Aquifer Region Chen, C.C., D. Gillig, and B.A. McCarl, "Effects of Climatic Change on a Water Dependent Regional Economy: A Study of the Texas Edwards Aquifer," Climatic Change, 49, 397-409, 2001.
Live with it – Ecology, Ag, M&I, Water • Use data for 2030 and 2090 • Canadian Climate Center Model (CCC) • Hadley Climate Center Model (HAD) • Average changes for the 10 year periods Climate Change Scenario Temperature Precipitation (0F) (Inches) HAD 2030 3.20 -4.10 HAD 2090 9.01 -0.78 CCC 2030 5.41 -14.36 CCC 2090 14.61 -4.56
(% change from the BASE ) Hadley Canadian Recharge in Drought Years -20.59 - - 29.65 Recharge in Normal Years - 19.68 - - 28.99 - Recharge in Wet Years - 23.64 - - 34.42 - Live with it – Ecology, Ag, M&I, Water Results for EA Recharge Prediction • Municipal Demand • Forecasted that climate change will increase municipal water demand by 1.5% (HAD) to 3.5% (CCC).
Live with it – Ecology, Ag, M&I, Water • Strongest effects fall on springflow and the Ag sector • Shifts in the sectoral water use share from Ag to M&I • Decrease in M&I welfare • Farm income falls 16-30% under the 2030 scenario and 30-45% under the 2090 scenario. • Decrease in Comal springflows by 10-16% under the 2030 scenarios and by 20-24% under 2090 scenarios • To maintain Springflow • Pumping level • decreases 35,000 to 50,000 af ala 2030 scenarios • decreases 55,000 to 80,000 af ala 2090 scenarios • Substantial economic costs: an additional cost of $0.5 to $2 million per year
Live with it – Coastal Example 1 Sea Level and hurricanes Adapt Structural protection Abandonment http://yosemite.epa.gov/oar/globalwarming.nsf/content/ResourceCenterPublicationsSLRMapsIndex.html http://www.glo.state.tx.us/coastal/erosion/reimbursement/pdf/Surfside_Beach_historic_shorelines.pdf
Avoid it – GHG Emission Mitigation • What are the strategies • Reduce where the emissions are • Fuel standards • Fuel switching • Emissions capture and storage • Conservation – lightbulbs • Lifestyle • Offset from elsewhere • Agriculture • Forestry • Biofuels
Avoid it – Energy A tall order http://txsdc.utsa.edu/tpepp/2006projections/summary/ Source: USDOE Texas Energy Consumption http://www.eere.energy.gov/states/state_specific_statistics.cfm/state=TX#consumption http://tonto.eia.doe.gov/state/state_energy_profiles.cfm?sid=TX
Avoid it – Energy • Big Needs • Renewables • Fuel Standards • Improved miles per gallon • Fuel switching • CCS – Future Gen • Offsets from elsewhere
Avoid it – Ag and Forest Agricultural/Forestry/Biofuel Mitigation Possibilities Strategy Basic Nature CO2 CH4 N2O Crop Mix Alteration Emis, Seq X X Crop Fertilization Alteration Emis, Seq X X Crop Input Alteration Emission X X Crop Tillage Alteration Emission X X Grassland Conversion Sequestration X Irrigated /Dry land Mix Emission X X Biofuel Production Offset X X X Stocker/Feedlot mix Emission X Enteric fermentation Emission X Livestock Herd Size Emission X X Livestock System Change Emission X X Manure Management Emission X X Rice Acreage Emission X X X Afforestation (not today) Sequestration X Existing timberland Management Sequestration X Deforestation Emission X Murray, B.C., A.J. Sommer, B. Depro, B.L. Sohngen, B.A. McCarl, D. Gillig, B. de Angelo, and K. Andrasko, Greenhouse Gas Mitigation Potential in US Forestry and Agriculture, EPA Report 430-R-05-006, November, 2005. http://www.epa.gov/sequestration/pdf/greenhousegas2005.pdf McCarl, B.A., and U.A. Schneider, "The Cost of Greenhouse Gas Mitigation in US Agriculture and Forestry," Science, Volume 294 (21 Dec), 2481-2482, 2001.
Emit CO2 Absorb CO2 Avoid it – Biofuel Please Pretend the growing stuff includes crops Feedstocks take up CO2 when they grow CO2 emitted when feedstocks burned or when energy product derivatives burned But Starred areas also emit Source of underlying graphic: Smith, C.T. , L. Biles, D. Cassidy, C.D. Foster, J. Gan, W.G. Hubbard, B.D. Jackson, C. Mayfield and H.M. Rauscher, “Knowledge Products to Inform Rural Communities about Sustainable Forestry for Bioenergy and Biobased Products”, IUFRO Conference on Transfer of Forest Science Knowledge and Technology, Troutdale, Oregon, 10-13 May 2005
Avoid it – Biofuel GHG Offsets by Biofuels Authors calculations, discussed in McCarl, B.A., and J.M. Reilly, "Agriculture in the climate change and energy price squeeze: Part 2: Mitigation Opportunities," Dept of Ag Econ, 2006 but updated since then.