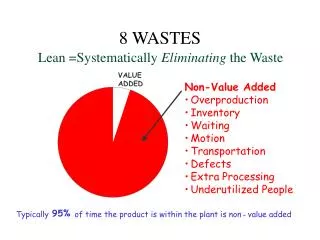
What is Value Added?
What is Value Added?. WHAT IS VALUE ADDED?. “A progress metric that estimates teachers’, schools’, and districts’ impact on students academic performances over time.” p.3 Kennedy, Peters, & Thomas (2012). WHAT DOES IT MEASURE?. VA MEASURES PROGRESS BASED ON ACHIEVEMENT.

What is Value Added?
E N D
Presentation Transcript
WHAT IS VALUE ADDED? “A progress metric that estimates teachers’, schools’, and districts’ impact on students academic performances over time.” p.3 Kennedy, Peters, & Thomas (2012)
VA MEASURES PROGRESS BASED ON ACHIEVEMENT WHAT IS ACHIEVEMENT? WHAT IS PROGRESS? MEASURES STUDENTS’ PROGRESS BETWEEN TWO POINTS IN TIME COMPARES STUDENTS’ PERFORMANCE TO THEIR OWN PRIOR ACHIEVEMENT (BATTELLE FOR KIDS, 2012) • MEASURES STUDENTS’ PERFORMANCES AT A SINGLE POINT IN TIME • COMPARES STUDENTS’ PERFORMANCE TO A STANDARD
To show progress made by individual students To show extent that teachers and districts contributed to that progress To examine effectiveness of instructional practices To determine root causes of weaknesses To inform communities of districts’ progress rather than just reporting passage rates on assessments To create research and policy development To evaluate teachers
MOST TEACHERS WILL BE PRIMARILY INTERESTED IN THE TEACHER-LEVEL REPORTS
WHAT WILL TEACHER LEVEL REPORTS SHOW? • Relative growth that a teacher produces during a particular school year • Determined by comparing teacher growth to the “average” teacher to which they are being compared • Disaggregated data about specific student groups’ growth patterns • Special needs, gender, ELL, etc. • A percentile rank of where a teacher’s value- added falls
POINTS TO CONSIDER… • This report shows the progress of a 4th grader. • This student completed a norm-referenced test (NRT) in 2nd and 3rd grade. He also completed a state test in 4th grade.
Although this student is well below district and state averages, he is making significant progress.
WHAT CAN A TEACHER TELL FROM THIS REPORT BASED ON THE “SCHOOL EFFECT” & “TESTING POOL AVG” COLUMNS?
POINTS TO CONSIDER… • TESTING POOL- Set of school districts that forms the comparison group for value-added analysis. Pooled districts have the same testing history. • SCHOOL EFFECT- Average impact the school has on students’ progress in a specific grade level and subject area. • STANDARD ERROR- Statistic that establishes a level of certainty associated with estimated mean gain. Generally, the smaller the standard error, the more precise the estimate of the effect.
ANSWER: • 5TH AND 8TH GRADES WERE BELOW EXPECTED GROWTH IN YEAR 2. • 7TH GRADE WAS ABOVE EXPECTED GROWTH IN YEAR 2. • 6TH GRADE WAS ABOVE EXPECTED GROWTH IN BOTH YEARS.
SO WHAT? • TEACHERS IN 5TH AND 8TH GRADE NEED TO EXAMINE THEIR INSTRUCTIONAL METHODS AND EVALUATIONS TO DETERMINE THE ROOT CAUSES OF THESE DECLINES.
POINTS TO CONSIDER • QUINTILE- Subgroups produced when an entire data set is divided into 5 groups of equal size. For this report, students are placed based on their prior academic performance. • MEAN PREDICTED SCORE- Average predicted score for a particular group of students based on their prior achievement and the relationships that exist between the assessments they have taken.
ANSWER: • STUDENTS IN 2ND, 4TH, AND 5TH QUINTILES BENEFITED THE MOST. • STUDENTS IN THE 1ST AND 3RD QUINTILES BENEFITED THE LEAST. • This is because the 11 students in the 1st quintile scored an average 7.5 scale score points below where they were expected to score, and the 24 students in the 3rd quintilescored almost 5 points below where they were expected to score. • Students in the 2nd, 4th and 5th quintiles scored below where they were expected to score but within one standard error of expected results. • The means in the 1st and 3rd quintiles are statistically significant at one standard error. • This means that the 8th grade social studies teachers produced lower than expected scores with students in these two quintiles.
SO WHAT? • TEACHERS NEED TO DETERMINE HOW TO BETTER MEET THE NEEDS OF STUDENTS IN THE 1ST AND 3RD QUINTILES.
WHAT ELSE CAN A TEACHER DO WITH THIS INFORMATION? • Determine for which specific groups of students their instruction is being effective • Identify their strengths and weaknesses as a teacher • Examine effectiveness of their instruction and assessment • Create an action plan for improvement • Obtain specific professional development based on identified weaknesses
SOURCES: • Battelle for Kids. (2010). Understanding and using value-added analysis: A toolkit for educators. Columbus, OH: Battelle for Kids. • Kennedy, K., Peters, M., & Thomas, M. (2012). How to use value-added analysis to improve student learning: A field guide for school and district leaders. Thousand Oaks, CA: Corwin.
Further information and actual school data can be found at https://ohiova.sas.com/evaas/login.jsp