Download
1 / 11
110 likes | 242 Views
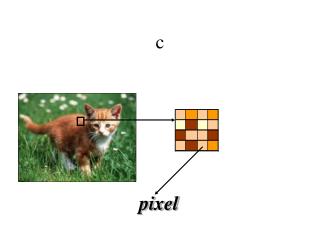
PDE of 1600-pixel MPPC. Sudo Yuji Tsukuba Univ. 2007.1.23. MPPC. LED. WLSF. PMT. Φ 0.5. Photon Detection Efficiency ( PDE ). ~ a probability that detect a photoelectron for one photon. Q.E. : quantum efficiency that is a probability of

E N D
PDE of 1600-pixel MPPC Sudo Yuji Tsukuba Univ. 2007.1.23
MPPC LED WLSF PMT Φ0.5 Photon Detection Efficiency ( PDE ) ~a probability that detect a photoelectron for one photon • Q.E. : quantum efficiency that is a probability of creation of a pair of e- h+ for one photon • eGeiger : a probability that arise avalanche for electron • egeom : a proportion of effective region in a sensor Measurement method • Relative # of p.e. for reference PMT
Gate Generator Clock Generator Set up PC Gate Delay Signal input AMP *63 Green LED MPPC WLSF Voltage source Stage PMT HV Thermo-static chamber Voltage source
Light yeild measurement( with noise and cross-talk subtraction) • Measure light yeild of LED light pulse • Fit ADC distributon • Supposed signals are dominated by Poisson statistics • Count number of events below 0.5 p.e. threshold ( both LED on and off ) 0.5 p.e. threshold pedestal Events 0.5 p.e. threshold pedestal Events
Calculation of Np.e. • f(n,μ) is Poisson distribution function • μ is Expectated number of Np.e. • f(0,μLED on), f(0,μLED off ) are probability of 0 p.e. • f(0,μnoise) = NLED off/ NLED off = e-μnoise • f(0,μLED on) = NLED on / NLED on =e-μLED on • f(0,μLED on) = f(0, μ+μnoise) = f(0,μ) × f(0,μnoise) f(0,μ) =f(0,μLED on) / f(0,μnoise) = e-μ μ = -ln( f(0,μ) ) all pedestal pedestal all
Mean of QE for 1 p.e. QE × relative light yeild on each wave length ∑( QE × relative light yeild on each wave length ) = Mean of QE for 1 p.e. ~16.7 %
Max Min Photon Detection Efficiency ( PDE ) ±~ 6.3 % • PDE of PMT is ~ 16.7 % • 6.3 % uncertainty cames from estimation of PMT P.D.E
Summary • We measured PDE of a 1600-pixel MPPC. • P.D.E increases with over voltage ( Vbias – V0), and saturated around 23 %. • But we don’t know correct QE data and light yeild distribution of a WLS fiber ( Y-11 ) . • Therefore the uncertainty is ~ 6.3 %. • We will have three PMTs on 2/14 that have QE data which are measured by HPK . • We have to measure with an apparatus which is known wave length or measure WLSF light yeild distribution for wave length.