1 / 1
10 likes | 53 Views
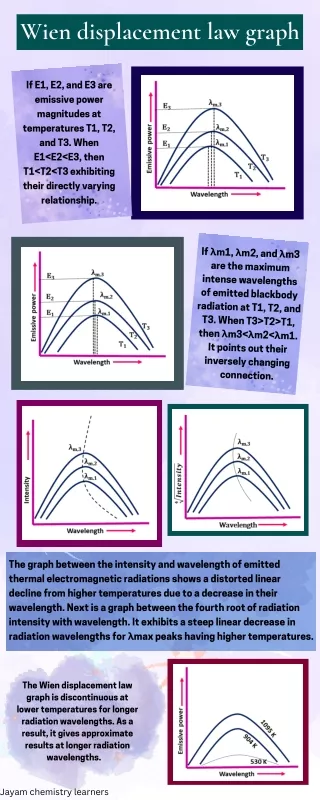
It is a graphical explanation of a blackbody's emissive power and radiation wavelength at various temperatures. We know blackbody emissions are temperature specific. And a blackbody graph is an overall variation of a blackbody's emissive power as a function of wavelength measured at different temperatures.

E N D
Wien displacement law graph If E1, E2, and E3 are emissive power magnitudes at temperatures T1, T2, and T3. When E1<E2<E3, then T1<T2<T3 exhibiting their directly varying relationship. If λm1, λm2, and λm3 are the maximum intense wavelengths of emitted blackbody radiation at T1, T2, and T3. When T3>T2>T1, then λm3<λm2<λm1. It points out their inversely changing connection. The graph between the intensity and wavelength of emitted thermal electromagnetic radiations shows a distorted linear decline from higher temperatures due to a decrease in their wavelength. Next is a graph between the fourth root of radiation intensity with wavelength. It exhibits a steep linear decrease in radiation wavelengths for λmax peaks having higher temperatures. The Wien displacement law graph is discontinuous at lower temperatures for longer radiation wavelengths. As a result, it gives approximate results at longer radiation wavelengths. Jayam chemistry learners