Download
1 / 21
210 likes | 246 Views
The demand for Styrene also dipped as the construction and automobile sectors were drastically hit. Though its demand to make Polystyrene was increased due to the rise in e-commerce amid the covid crisis and PS is largely used in the packaging industry which helps the Styrene market to sustain and recovered easily amid pandemics.

E N D
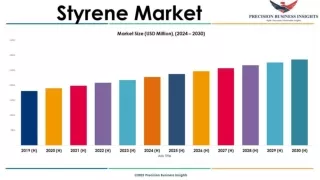
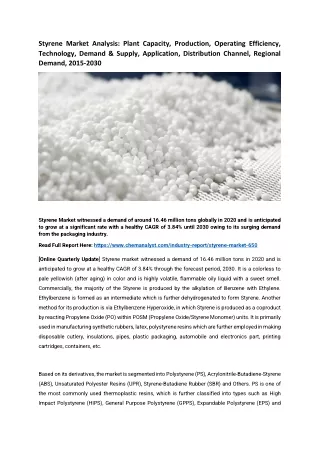
Styrene Market Analysis: Plant Capacity, Production, Operating Efficiency, Technology, Demand & Supply, Application, Distribution Channel, Regional Demand, 2015-2030 Styrene Market witnessed a demand of around 16.46 million tons globally in 2020 and is anticipated to grow at a significant rate with a healthy CAGR of 3.84% until 2030 owing to its surging demand from the packaging industry. Read Full Report Here: https://www.chemanalyst.com/industry-report/styrene-market-650 [Online Quarterly Update] Styrene market witnessed a demand of 16.46 million tons in 2020 and is anticipated to grow at a healthy CAGR of 3.84% through the forecast period, 2030. It is a colorless to pale yellowish (after aging) in color and is highly volatile, flammable oily liquid with a sweet smell. Commercially, the majority of the Styrene is produced by the alkylation of Benzene with Ethylene. Ethylbenzene is formed as an intermediate which is further dehydrogenated to form Styrene. Another method for its production is via Ethylbenzene Hyperoxide, in which Styrene is produced as a coproduct by reacting Propylene Oxide (PO) within POSM (Propylene Oxide/Styrene Monomer) units. It is primarily used in manufacturing synthetic rubbers, latex, polystyrene resins which are further employed in making disposable cutlery, insulations, pipes, plastic packaging, automobile and electronics part, printing cartridges, containers, etc. Based on its derivatives, the market is segmented into Polystyrene (PS), Acrylonitrile-Butadiene-Styrene (ABS), Unsaturated Polyester Resins (UPR), Styrene-Butadiene Rubber (SBR) and Others. PS is one of the most commonly used thermoplastic resins, which is further classified into types such as High Impact Polystyrene (HIPS), General Purpose Polystyrene (GPPS), Expandable Polystyrene (EPS) and
Extruded Polystyrene (XPS). Surging demand for PS from the packaging industry is likely to drive the demand in the forthcoming years. Styrene and its derivatives find applications in various end-use industries such as Automobile, Packaging, Construction, Consumer Goods, and Others. Thereby, growth in these end-user industries is anticipated to boost the market over the forecast period. However, the health and environmental hazards associated with the chemical compound may hamper its market growth in the forecast period. In the first half of 2020, the sudden outbreak of the COVID-19 pandemic, led to the imposition of nationwide lockdowns by the major economies to control the spread of virus. It resulted into slowdown in industrial operations due to raw material scarcity, labor shortage, etc. that subsequently impacted the growth of industries worldwide. The demand for Styrene also dipped as the construction and automobile sectors were drastically hit. Though its demand to make Polystyrene was increased due to the rise in e-commerce amid the covid crisis and PS is largely used in the packaging industry which helps the Styrene market to sustain and recovered easily amid pandemics. However, in the latter half of 2020, an improvement in the demand for Styrene is witnessed due to the speedy recovery in the automobile, construction and other end-use industries, thereby, driving the growth of the market over the forecast years. Years Considered for this Report: Historical Years: 2015 – 2019 Base Year: 2020 Estimated Year: 2021 Forecast Period: 2022 – 2030 Objective of the Study: • The primary objective of the study was to evaluate and forecast the Styrene capacity, production, demand, inventory, and demand–supply gap globally. • To categorize Styrene demand based on End Use, Type, Region, and Distribution channel • To identify major customers of Styrene globally. • To evaluate and forecast Styrene pricing globally. • To identify and profile major companies operating globally Styrene market. • To identify major news, deals and expansion plans globally Styrene market.
Regional Outlook: Region wise, Asia Pacific accounted for the maximum share of the Styrene market, followed by North America. Due to rapid industrialization, urbanization, ongoing construction projects in the region, market is expected to boost through 2030. Moreover, China is a manufacturing hub of Consumer Goods, Electronics, and Plastics which is also likely to drive the market for Styrene over the forecast period. Key Players: ➢Chevron Phillips Chemical Company ➢Bayer Material science ➢Royal Dutch Shell plc. ➢Ashland Inc ➢Nova Chemicals Corporation ➢SABIC Co. ➢Ineos Group AG ➢Alpek S.A.B. de C.V. ➢Hanwha Group, Eni S.p.A., and TotalEnergies S.A. among others.
To extract data for Global Styrene market, primary research surveys were conducted with Styrene manufacturers, suppliers, distributors, wholesalers and end users. While interviewing, the respondents were also inquired about their competitors. Through this technique, Chemanol’s was able to include manufacturers that could not be identified due to the limitations of secondary research. Moreover, chemicals analyzed various end user segments and projected a positive outlook for Global Styrene market over the coming years. ChemAnalyst calculated Styrene demand globally by analyzing the historical data and demand forecast which was carried out considering the Application industries growth. ChemAnalyst sourced these values from industry experts and company representatives and externally validated through analyzing historical sales data of respective manufacturers to arrive at the overall market size. Various secondary sources such as company websites, association reports, annual reports, etc., were also studied by ChemAnalyst. Key Target Audience • Styrene manufacturers and other stakeholders • Organizations, forums and alliances related to Styrene distribution • Government bodies such as regulating authorities and policy makers • Market research organizations and consulting companies The study is useful in providing answers to several critical questions that are important for industry stakeholders, such as Styrene manufacturers, distributors and policymakers. The report also provides useful insights about which market segments should be targeted over the coming years to strategize investments and capitalize on growth opportunities. Report Scope: In this report, the Global Styrene market has been segmented into following categories, in addition to the industry trends which have also been detailed below:
Attribute Details Market size volume in 2020 16.46 million Tons Growth Rate CAGR of 3.84% from 2021 to 2030 Base year for estimation 2020 Historic Data 2015 – 2019 Forecast period 2021 – 2030 Quantitative units Revenue in USD million/billion and CAGR from 2021 to 2030 Report coverage Revenue forecast, demand & supply, competitive analysis, competitive landscape, growth factors, and trends •End Use: (Automobile, Packaging, Construction, Consumer Goods and Others) •Type: (Polystyrene (PS), Acrylonitrile-Butadiene-Styrene (ABS), Unsaturated Polyester Resins (UPR), Styrene-Butadiene Rubber (SBR) and Others) •Distribution Channel (Direct/Institutional Sales, Other Channel Sales) Segments covered Regional scope North America; Europe; Asia Pacific; South America; Middle East & Africa Country scope United States; Mexico; Canada; China; India; Japan; South Korea; Taiwan; Singapore; Germany; Belgium; France; United Kingdom; Spain; Italy; Sweden; Austria; Saudi Arabia; Iran; South Africa; Brazil; Argentina Key companies profiled Chevron Phillips Chemical Company, Bayer Material science, Royal Dutch Shell plc., Ashland Inc, Nova Chemicals Corporation, SABIC Co., Ineos Group AG, Alpek S.A.B. de C.V., Hanwha Group, Eni S.p.A., and TotalEnergies S.A. among others Customization scope Free report customization with purchase. Addition or alteration to country, regional & segment scope. Pricing and purchase options Avail customized purchase options to meet your exact research needs. Explore purchase options
TABLE OF CONTENTS 1. Global Styrene Market Outlook, 2015-2030 1.1. Capacity, By Volume 1.1.1. By Company 1.2. Production, By Volume 1.2.1. By Company 1.3. Operating Efficiency 1.3.1. By Company 2. Global Styrene Demand Outlook, 2015-2030, By Volume 2.1. By End Use 2.2. By Type 2.3. By Region 2.4. By Company 2.5. By Sales channel 3. North America Styrene Market Outlook, 2015-2030 3.1. Capacity, By Volume 3.1.1. By Country 3.2. Production 3.2.1. By Country 3.3. Operating Efficiency 3.3.1. By Country 4. North America Styrene Demand Outlook, 2015-2030, By Volume 4.1. By End Use 4.2. By Type 4.3. By Country 4.4. United States Styrene Market Outlook, 2015-2030 4.4.1. Capacity, By Volume 4.4.1.1. By Company 4.4.1.2. By Location 4.4.2. Production
4.4.2.1. By Company 4.4.3. Operating Efficiency 4.4.3.1. By Company 4.4.4. United States Styrene Demand-Supply Scenario, 2015-2030, By Volume 4.4.4.1. Demand 4.4.4.2. Supply 4.4.4.3. Gap 4.4.5. United States Styrene Demand Outlook, 2015-2030, By Volume 4.4.5.1. By End Use 4.4.5.2. By Type 4.4.5.3. By Company Share (At least top 3 companies’ market share) 4.4.5.4. By Region 4.4.5.5. By Sales Channel 4.5. Mexico Styrene Market Outlook, 2015-2030 4.5.1. Capacity, By Volume 4.5.1.1. By Company 4.5.1.2. By Location 4.5.2. Production 4.5.2.1. By Company 4.5.3. Operating Efficiency 4.5.3.1. By Company 4.5.4. Mexico Styrene Demand-Supply Scenario, 2015-2030, By Volume 4.5.4.1. Demand 4.5.4.2. Supply 4.5.4.3. Gap 4.5.5. Mexico Styrene Demand Outlook, 2015-2030, By Volume 4.5.5.1. By End Use 4.5.5.2. By Type 4.5.5.3. By Company Share (At least top 3 companies’ market share) 4.5.5.4. By Region 4.5.5.5. By Sales Channel
4.6. Canada Styrene Market Outlook, 2015-2030 4.6.1. Capacity, By Volume 4.6.1.1. By Company 4.6.1.2. By Location 4.6.2. Production 4.6.2.1. By Company 4.6.3. Operating Efficiency 4.6.3.1. By Company 4.6.4. Canada Styrene Demand-Supply Scenario, 2015-2030, By Volume 4.6.4.1. Demand 4.6.4.2. Supply 4.6.4.3. Gap 4.6.5. Canada Styrene Demand Outlook, 2015-2030, By Volume 4.6.5.1. By End Use 4.6.5.2. By Type 4.6.5.3. By Company Share (At least top 3 companies’ market share) 4.6.5.4. By Region 4.6.5.5. By Sales Channel 5. Asia Pacific Styrene Market Outlook, 2015-2030 5.1. Capacity, By Volume 5.1.1. By Country 5.2. Production 5.2.1. By Country 5.3. Operating Efficiency 5.3.1. By Country 6. Asia Pacific Styrene Demand Outlook, 2015-2030, By Volume 6.1. By End Use 6.2. By Type 6.3. By Country 6.4. China Styrene Market Outlook, 2015-2030 6.4.1. Capacity, By Volume
6.4.1.1. By Company 6.4.1.2. By Location 6.4.2. Production 6.4.2.1. By Company 6.4.3. Operating Efficiency 6.4.3.1. By Company 6.4.4. China Styrene Demand-Supply Scenario, 2015-2030, By Volume 6.4.4.1. Demand 6.4.4.2. Supply 6.4.4.3. Gap 6.4.5. China Styrene Demand Outlook, 2015-2030, By Volume 6.4.5.1. By End Use 6.4.5.2. By Type 6.4.5.3. By Company Share (At least top 3 companies’ market share) 6.4.5.4. By Region 6.4.5.5. By Sales Channel 6.5. India Styrene Market Outlook, 2015-2030 6.5.1. Capacity, By Volume 6.5.1.1. By Company 6.5.1.2. By Location 6.5.2. Production 6.5.2.1. By Company 6.5.3. Operating Efficiency 6.5.3.1. By Company 6.5.4. India Styrene Demand-Supply Scenario, 2015-2030, By Volume 6.5.4.1. Demand 6.5.4.2. Supply 6.5.4.3. Gap 6.5.5. India Styrene Demand Outlook, 2015-2030, By Volume 6.5.5.1. By End Use 6.5.5.2. By Type
6.5.5.3. By Company Share (At least top 3 companies’ market share) 6.5.5.4. By Region 6.5.5.5. By Sales Channel 6.6. Japan Styrene Market Outlook, 2015-2030 6.6.1. Capacity, By Volume 6.6.1.1. By Company 6.6.1.2. By Location 6.6.2. Production 6.6.2.1. By Company 6.6.3. Operating Efficiency 6.6.3.1. By Company 6.6.4. Japan Styrene Demand-Supply Scenario, 2015-2030, By Volume 6.6.4.1. Demand 6.6.4.2. Supply 6.6.4.3. Gap 6.6.5. Japan Styrene Demand Outlook, 2015-2030, By Volume 6.6.5.1. By End Use 6.6.5.2. By Type 6.6.5.3. By Company Share (At least top 3 companies’ market share) 6.6.5.4. By Region 6.6.5.5. By Sales Channel 6.7. South Korea Styrene Market Outlook, 2015-2030 6.7.1. Capacity, By Volume 6.7.1.1. By Company 6.7.1.2. By Location 6.7.2. Production 6.7.2.1. By Company 6.7.3. Operating Efficiency 6.7.3.1. By Company 6.7.4. South Korea Styrene Demand-Supply Scenario, 2015-2030, By Volume 6.7.4.1. Demand
6.7.4.2. Supply 6.7.4.3. Gap 6.7.5. South Korea Styrene Demand Outlook, 2015-2030, By Volume 6.7.5.1. By End Use 6.7.5.2. By Type 6.7.5.3. By Company Share (At least top 3 companies’ market share) 6.7.5.4. By Region 6.7.5.5. By Sales Channel 6.8. Taiwan Styrene Market Outlook, 2015-2030 6.8.1. Capacity, By Volume 6.8.1.1. By Company 6.8.1.2. By Location 6.8.2. Production 6.8.2.1. By Company 6.8.3. Operating Efficiency 6.8.3.1. By Company 6.8.4. Taiwan Styrene Demand-Supply Scenario, 2015-2030, By Volume 6.8.4.1. Demand 6.8.4.2. Supply 6.8.4.3. Gap 6.8.5. Taiwan Styrene Demand Outlook, 2015-2030, By Volume 6.8.5.1. By End Use 6.8.5.2. By Type 6.8.5.3. By Region 6.8.5.4. By Sales Channel 6.8.5.5. By Company Share (At least top 3 companies’ market share) 6.9. Singapore Styrene Market Outlook, 2015-2030 6.9.1. Capacity, By Volume 6.9.1.1. By Company 6.9.1.2. By Location 6.9.2. Production
6.9.2.1. By Company 6.9.3. Operating Efficiency 6.9.3.1. By Company 6.9.4. Singapore Styrene Demand-Supply Scenario, 2015-2030, By Volume 6.9.4.1. Demand 6.9.4.2. Supply 6.9.4.3. Gap 6.9.5. Singapore Styrene Demand Outlook, 2015-2030, By Volume 6.9.5.1. By End Use 6.9.5.2. By Type 6.9.5.3. By Region 6.9.5.4. By Sales Channel 6.9.5.5. By Company Share (At least top 3 companies’ market share) 7. Europe Styrene Market Outlook, 2015-2030 7.1. Capacity, By Volume 7.1.1. By Country 7.2. Production 7.2.1. By Country 7.3. Operating Efficiency 7.3.1. By Country 8. Europe Styrene Demand Outlook, 2015-2030, By Volume 8.1. By End Use 8.2. By Type 8.3. By Sales Channel (Direct/Institutional Sales, Retail Sales, Other Channel Sales) 8.4. By Country 8.5. Germany Styrene Market Outlook, 2015-2030 8.5.1. Capacity, By Volume 8.5.1.1. By Company 8.5.1.2. By Location 8.5.2. Production 8.5.2.1. By Company
8.5.3. Operating Efficiency 8.5.3.1. By Company 8.5.4. Germany Styrene Demand-Supply Scenario, 2015-2030, By Volume 8.5.4.1. Demand 8.5.4.2. Supply 8.5.4.3. Gap 8.5.5. Germany Styrene Demand Outlook, 2015-2030, By Volume 8.5.5.1. By End Use 8.5.5.2. By Type 8.5.5.3. By Company Share (At least top 3 companies’ market share) 8.5.5.4. By Region 8.5.5.5. By Sales Channel 8.5.6. Belgium Styrene Market Outlook, 2015-2030 8.5.6.1. Capacity, By Volume 8.5.6.1.1. By Company 8.5.6.1.2. By Location 8.5.6.2. Production 8.5.6.2.1. By Company 8.5.6.3. Operating Efficiency 8.5.6.3.1. By Company 8.5.7. Belgium Styrene Demand-Supply Scenario, 2015-2030, By Volume 8.5.7.1. Demand 8.5.7.2. Supply 8.5.7.3. Gap 8.5.8. Belgium Styrene Demand Outlook, 2015-2030, By Volume 8.5.8.1. By End Use 8.5.8.2. By Type 8.5.8.3. By Sales Channel 8.5.8.4. By Company Share (At least top 3 companies’ market share) 8.5.8.5. By Region 8.6. France Styrene Market Outlook, 2015-2030
8.6.1. Capacity, By Volume 8.6.1.1. By Company 8.6.1.2. By Location 8.6.2. Production 8.6.2.1. By Company 8.6.3. Operating Efficiency 8.6.3.1. By Company 8.6.4. France Styrene Demand-Supply Scenario, 2015-2030, By Volume 8.6.4.1. Demand 8.6.4.2. Supply 8.6.4.3. Gap 8.6.5. France Styrene Demand Outlook, 2015-2030, By Volume 8.6.5.1. By End Use 8.6.5.2. By Type 8.6.5.3. By Sales Channel 8.6.5.4. By Company Share (At least top 3 companies’ market share) 8.6.5.5. By Region 8.7. United Kingdom Styrene Market Outlook, 2015-2030 8.7.1. Capacity, By Volume 8.7.1.1. By Company 8.7.1.2. By Location 8.7.2. Production 8.7.2.1. By Company 8.7.3. Operating Efficiency 8.7.3.1. By Company 8.7.4. United Kingdom Styrene Demand-Supply Scenario, 2015-2030, By Volume 8.7.4.1. Demand 8.7.4.2. Supply 8.7.4.3. Gap 8.7.5. United Kingdom Styrene Demand Outlook, 2015-2030, By Volume 8.7.5.1. By End Use
8.7.5.2. By Type 8.7.5.3. By Sales Channel 8.7.5.4. By Company Share (At least top 3 companies’ market share) 8.7.5.5. By Region 8.8. Spain Styrene Market Outlook, 2015-2030 8.8.1. Capacity, By Volume 8.8.1.1. By Company 8.8.1.2. By Location 8.8.2. Production 8.8.2.1. By Company 8.8.3. Operating Efficiency 8.8.3.1. By Company 8.8.4. Spain Styrene Demand-Supply Scenario, 2015-2030, By Volume 8.8.4.1. Demand 8.8.4.2. Supply 8.8.4.3. Gap 8.8.5. Spain Styrene Demand Outlook, 2015-2030, By Volume 8.8.5.1. By End Use 8.8.5.2. By Type 8.8.5.3. By Sales Channel 8.8.5.4. By Company Share (At least top 3 companies’ market share) 8.8.5.5. By Region 8.9. Italy Styrene Market Outlook, 2015-2030 8.9.1. Capacity, By Volume 8.9.1.1. By Company 8.9.1.2. By Location 8.9.2. Production 8.9.2.1. By Company 8.9.3. Operating Efficiency 8.9.3.1. By Company 8.9.4. Italy Styrene Demand-Supply Scenario, 2015-2030, By Volume
8.9.4.1. Demand 8.9.4.2. Supply 8.9.4.3. Gap 8.9.5. Italy Styrene Demand Outlook, 2015-2030, By Volume 8.9.5.1. By End Use 8.9.5.2. By Type 8.9.5.3. By Sales Channel 8.9.5.4. By Company Share (At least top 3 companies’ market share) 8.9.5.5. By Region 8.10. Sweden Styrene Market Outlook, 2015-2030 8.10.1. Capacity, By Volume 8.10.1.1. By Company 8.10.1.2. By Location 8.10.2. Production 8.10.2.1. By Company 8.10.3. Operating Efficiency 8.10.3.1. By Company 8.10.4. Sweden Styrene Demand-Supply Scenario, 2015-2030, By Volume 8.10.4.1. Demand 8.10.4.2. Supply 8.10.4.3. Gap 8.10.5. Sweden Styrene Demand Outlook, 2015-2030, By Volume 8.10.5.1. By End Use 8.10.5.2. By Type 8.10.5.3. By Sales Channel 8.10.5.4. By Company Share (At least top 3 companies’ market share) 8.10.5.5. By Region 8.11. Austria Styrene Market Outlook, 2015-2030 8.11.1. Capacity, By Volume 8.11.1.1. By Company 8.11.1.2. By Location
8.11.2. Production 8.11.2.1. By Company 8.11.3. Operating Efficiency 8.11.3.1. By Company 8.11.4. Austria Styrene Demand-Supply Scenario, 2015-2030, By Volume 8.11.4.1. Demand 8.11.4.2. Supply 8.11.4.3. Gap 8.11.5. Austria Styrene Demand Outlook, 2015-2030, By Volume 8.11.5.1. By End Use 8.11.5.2. By Type 8.11.5.3. By Sales Channel 8.11.5.4. By Company Share (At least top 3 companies’ market share) 8.11.5.5. By Region 9. MEA Styrene Market Outlook, 2015-2030 9.1. Capacity, By Volume 9.1.1. By Country 9.2. Production 9.2.1. By Country 9.3. Operating Efficiency 9.3.1. By Country 10. MEA Styrene Demand Outlook, 2015-2030, By Volume 10.1. By End Use 10.2. By Type 10.3. By Sales Channel 10.4. By Country 10.5. Saudi Arabia Styrene Market Outlook, 2015-2030 10.5.1. Capacity, By Volume 10.5.1.1. By Company 10.5.1.2. By Location 10.5.2. Production
10.5.2.1. By Company 10.5.3. Operating Efficiency 10.5.3.1. By Company 10.5.4. Saudi Arabia Styrene Demand-Supply Scenario, 2015-2030, By Volume 10.5.4.1. Demand 10.5.4.2. Supply 10.5.4.3. Gap 10.5.5. Saudi Arabia Styrene Demand Outlook, 2015-2030, By Volume 10.5.5.1. By End Use 10.5.5.2. By Type 10.5.5.3. By Sales Channel 10.5.5.4. By Company Share (At least top 3 companies’ market share) 10.5.5.5. By Region 10.6. Iran Styrene Market Outlook, 2015-2030 10.6.1. Capacity, By Volume 10.6.1.1. By Company 10.6.1.2. By Location 10.6.2. Production 10.6.2.1. By Company 10.6.3. Operating Efficiency 10.6.3.1. By Company 10.6.4. Iran Styrene Demand-Supply Scenario, 2015-2030, By Volume 10.6.4.1. Demand 10.6.4.2. Supply 10.6.4.3. Gap 10.6.5. Iran Styrene Demand Outlook, 2015-2030, By Volume 10.6.5.1. By End Use 10.6.5.2. By Type 10.6.5.3. By Sales Channel 10.6.5.4. By Company Share (At least top 3 companies’ market share) 10.6.5.5. By Region.
10.7. South Africa Styrene Market Outlook, 2015-2030 10.7.1. Capacity, By Volume 10.7.1.1. By Company 10.7.1.2. By Location 10.7.2. Production 10.7.2.1. By Company 10.7.3. Operating Efficiency 10.7.3.1. By Company 10.7.4. South Africa Styrene Demand-Supply Scenario, 2015-2030, By Volume 10.7.4.1. Demand 10.7.4.2. Supply 10.7.4.3. Gap 10.7.5. South Africa Styrene Demand Outlook, 2015-2030, By Volume 10.7.5.1. By End Use 10.7.5.2. By Type 10.7.5.3. By Sales Channel 10.7.5.4. By Company Share (At least top 3 companies’ market share) 10.7.5.5. By Region 11. South America Styrene Market Outlook, 2015-2030 11.1. Capacity, By Volume 11.1.1. By Country 11.2. Production 11.2.1. By Country 11.3. Operating Efficiency 11.3.1. By Country 12. South America Styrene Demand Outlook, 2015-2030, By Volume 12.1. By End Use 12.2. By Type 12.3. By Sales Channel (Direct/Institutional Sales, Retail Sales, Other Channel Sales) 12.4. By Company Share (At least top 3 companies’ market share) 12.5. By Country
12.6. Brazil Styrene Market Outlook, 2015-2030 12.6.1. Capacity, By Volume 12.6.1.1. By Company 12.6.1.2. By Location 12.6.2. Production 12.6.2.1. By Company 12.6.3. Operating Efficiency 12.6.3.1. By Company 12.6.4. Brazil Styrene Demand-Supply Scenario, 2015-2030, By Volume 12.6.4.1. Demand 12.6.4.2. Supply 12.6.4.3. Gap 12.6.5. Brazil Styrene Demand Outlook, 2015-2030, By Volume 12.6.5.1. By End Use 12.6.5.2. By Type 12.6.5.3. By Sales Channel 12.6.5.4. By Company Share (At least top 3 companies’ market share) 12.6.5.5. By Region 12.7. Argentina Styrene Market Outlook, 2015-2030 12.7.1. Capacity, By Volume 12.7.1.1. By Company 12.7.1.2. By Location 12.7.2. Production 12.7.2.1. By Company 12.7.3. Operating Efficiency 12.7.3.1. By Company 12.7.4. Argentina Styrene Demand-Supply Scenario, 2015-2030, By Volume 12.7.4.1. Demand 12.7.4.2. Supply 12.7.4.3. Gap 12.7.5. Argentina Styrene Demand Outlook, 2015-2030, By Volume
12.7.5.1. By End Use 12.7.5.2. By Type 12.7.5.3. By Sales Channel 12.7.5.4. By Company Share (At least top 3 companies’ market share 12.7.5.5. By Region 13. Country-wise Import 14. Country-wise Export 15. News and Deals About Us: ChemAnalyst is a leading provider of chemical commodity prices in more than 12 countries since from last 4 Years. The company has emerged as a preferred pricing supplier amongst Procurement Managers and Strategy Professionals globally who wants to track near real time prices of chemicals on its interactive dashboard. Unlike most of its competitors such as ICIS, IHS & S&P Platts the company doesn’t believe in delivering prices in PDF reports. The company has developed proprietary algorithm based online subscription platform in which users can track years of historical prices of more than 250 chemical commodities. In addition, since it’s all online, the users cannot just compare prices across multiple countries but also with other commodities and play with the data by generating multiple graphs to find out amazing insights. The users get access to grade wise CIF, CFR & Ex Works prices at multiple ports in each country. ChemAnalyst also provides market analysis for more than 1000+ chemical commodities such as Production, Demand, Supply, Plant Operating Rate, Imports, Exports, Suppliers, Customers and much more. The company has created online interactive dashboard in which customers can access all this data instantly with a click of a button. The users will not only be able to analyse historical data for past years but will also get to analyse short term and long-term forecasts for coming years. With the access to local field teams, the company can provide high quality reliable market analysis data for more than 20 countries. ChemAnalyst is a one stop solution for all the data related needs. We at ChemAnalyst are committed to assist customers worldwide with their data and insights needs using our comprehensive online platform. Contact Us: B-44, Sector -57, Noida, National Capital Region, UP, India 201301 Tel: +91-120-4523900 Email-id: sales@chemanalyst.com


![Artificial Intelligence Market Size, Share & Growth | Trends [2030]](https://cdn7.slideserve.com/12226439/artificial-intelligence-market-to-reflect-dt.jpg)