Download

1 / 15
150 likes | 167 Views
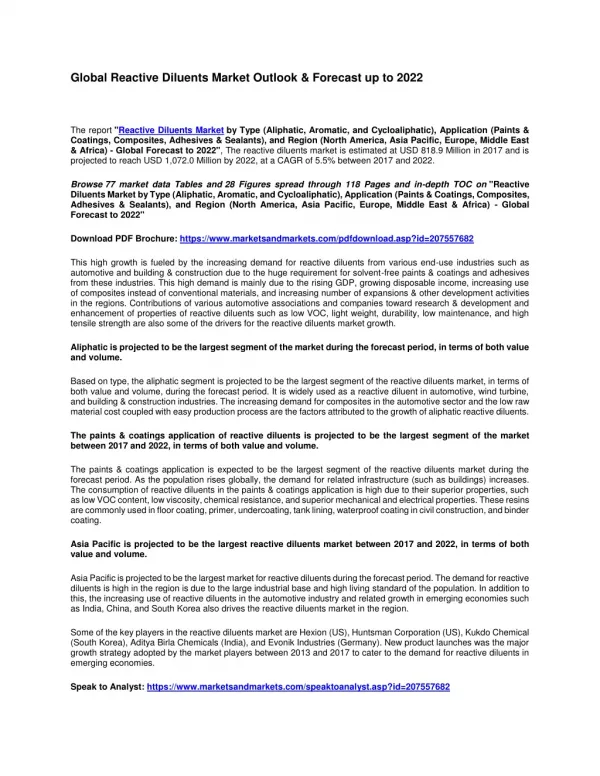
Reactive Diluents are of various types including aliphatic, aromatic, and cycloaliphatic. Due to their property enhancement capability, they find application in various areas including paints and coatings, composites, adhesives, and sealants. The growing construction sector coupled with the increasing use of composite materials is expected to drive the demand for Reactive Diluents during the forecast period. Moreover, increasing demand from automotive is also another factor influencing demand growth.

E N D
Reactive Diluents Market Analysis: Plant Capacity, Production, Operating Efficiency, Demand & Supply, End-User Industries, Distribution Channel, Regional Demand, 2015-2030 [Online Quarterly Update]Reactive Diluents demand stood at 0.78 million Tonnes in 2020 and is forecast to reach 1.490 million Tonnes by 2030, growing at a healthy CAGR of 6.75% until 2030. Reactive Diluents are colorless low viscosity liquids that are also known as thinners. They are glycidyl ethers of short-chain aliphatic alcohols or alkylphenols. Their main use is to reduce the viscosity of the material to which they are added which eases the handling of the material and its processing. Reactive Diluents also enhance properties such as adhesion, thermal stability, impact, and tensile strength, filler loading, flexibility, volatility reduction, and solvent resistance. The addition of Reactive Diluents to different systems also significantly reduces the emission of volatile organic compounds (VOC). They also act as substitutes for various plasticizers. Reactive Diluents are of various types including aliphatic, aromatic, and cycloaliphatic. Due to their property enhancement capability, they find application in various areas including paints and coatings, composites, adhesives, and sealants. The growing construction sector coupled with the increasing use of composite materials is expected to drive the demand for Reactive Diluents during the forecast period. Moreover, increasing demand from automotive is also another factor influencing demand growth. Read Full Report Here @ https://www.chemanalyst.com/industry-report/reactive-diluents- market-593 In 2020, the spread of COVID-19 in major global economies caused nationwide lockdowns which had an impact on several industries. Construction and automotive were among the most affected
industries during the pandemic. This had an impact on the demand for Reactive Diluents for the first half of 2020. Therefore, the demand for Reactive Diluents fell during the coronavirus pandemic. However, Reactive Diluents market bounced back due to speedy recovery in the major end use industries such as automotive, and construction after the relaxation in lockdown that led to increasing commercialization activities. Regional Outlook: Region-wise, Asia-pacific region holds the major share of global demand for Reactive Diluents due to the increasing demand of application areas including construction and automotive. Moreover, continuous revamping of infrastructure in disaster-prone countries like Japan and South Korea is also another factor propelling the demand for reactive diluents. Increasing population and subsequent rise in per capita income in emerging economies like India and China is also likely to enhance the market growth of Reactive Diluents in the forecast period. Key Players: •Hexion •Huntsman Corporation •Kukdo Chemical •Aditya Birla Chemicals •Evonik Industries •Adeka Corporation •Cargill •EMS-Griltech •Olin Corporation •Sachem •Arkema •Bluestar Wuxi Petrochemical •Atul Chemicals •Cardolite •DIC Corporation •Hubei Phoenix Chemical Company •Ipox Chemicals •Sakamoto Yakuhin Kogyo •Geo Specialty Chemicals •BASF SE •Nippon Shokubai Co. Ltd •Air Products and Chemicals •Italmatch Chemicals S.p.A among others. Years considered for this report: Historical Period: 2015-2019 Base Year: 2020 Estimated Year: 2021 Forecast Period: 2022–2030
This report will be delivered on an online digital platform with one-year subscription and quarterly update. Objective of the Study: •To assess the demand-supply scenario of Reactive Diluents which covers production, demand, and supply of Reactive Diluents market globally. •To analyse and forecast the market size of Reactive Diluents. •To classify and forecast global Reactive Diluents market based on technology, end-use and regional distribution. •To identify drivers and challenges for global Reactive Diluents market. •To examine competitive developments such as expansions, new product launches, mergers & acquisitions, etc. in global Reactive Diluents market. •To identify and analyse the profile of leading players involved in the manufacturing of Reactive Diluents. To extract data for global Reactive Diluents market, primary research surveys were conducted with Reactive Diluents manufacturers, suppliers, distributors, wholesalers and end users. While interviewing, the respondents were also inquired about their competitors. Through this technique, ChemAnalyst was able to include manufacturers that could not be identified due to the limitations of secondary research. Moreover, ChemAnalyst analyzed various end user segments and projected a positive outlook for Global Reactive Diluents market over the coming years. ChemAnalyst calculated Reactive Diluents demand globally by analyzing the historical data and demand forecast which was carried out considering imported reactive diluents, prices, materials used for production of Reactive Diluents. ChemAnalyst sourced these values from industry experts and company representatives and externally validated through analyzing historical sales data of respective manufacturers to arrive at the overall market size. Various secondary sources such as company websites, association reports, annual reports, etc., were also studied by ChemAnalyst. Key Target Audience:
•Reactive Diluents manufacturers and other stakeholders •Organizations, forums, and alliances related to Reactive Diluents distribution •Government bodies such as regulating authorities and policy makers •Market research organizations and consulting companies Report Scope: In this report, global Reactive Diluents market has been segmented into following categories, in addition to the industry trends which have also been detailed below: Attribute Details Market size volume in 20200.78 million Tonnes Market size volume in 20301.490 million Tonnes Growth Rate CAGR of 6.75% from 2021 to 2030 Base year for estimation 2020 Historic Data 2015 – 2019 Forecast period 2022 – 2030 Quantitative units Demand in tons and CAGR from 2021 to 2030 Report coverage Revenue forecast, demand & supply, competitive analysis, competitive landscape, growth factors, and trends Segments covered 1. Application: (Paints and Coatings, Composites, Adhesives and Sealants) 2. Type: (Aliphatic, Aromatic, Cycloaliphatic) 3. Sales Channel: (Direct/Institutional Sales, Indirect Sales) Regional scope North America; Europe; Asia Pacific; South America; Middle East & Africa Country scope United States; Mexico; Canada; China; India; Japan; South Korea; Taiwan; Singapore; Germany; Belgium; France; United Kingdom; Spain; Italy; Sweden; Austria; Saudi Arabia; Iran; South Africa; Brazil; Argentina Key companies profiled Hexion, Huntsman Corporation, Kukdo Chemical, Aditya Birla Chemicals, Evonik Industries, Adeka Corporation, Cargill, EMS-Griltech, Olin Corporation, Sachem, Arkema, Bluestar Wuxi Petrochemical, Atul Chemicals, Cardolite, DIC Corporation, Hubei Phoenix Chemical Company, Ipox Chemicals, Sakamoto Yakuhin Kogyo, Geo Specialty Chemicals, BASF SE, Nippon Shokubai Co. Ltd, Air Products and Chemicals, Italmatch Chemicals S.p.A among others. Customization scope Free report customization with purchase. Addition or alteration to country, regional & segment scope. Pricing options and purchase Avail customized purchase options to meet your exact research needs. Explore purchase options TABLE OF CONTENTS:
1.Global Reactive Diluents Market Outlook, 2015-2030 1.1.Capacity, By Volume 1.1.1.By Company 1.2.Production, By Volume 1.2.1.By Company 1.3.Operating Efficiency 1.3.1.By Company 2.Global Reactive Diluents Demand Outlook, 2015-2030, By Volume 2.1.By Type 2.2.By Application 2.3.By Region 2.4.By Company 3.North America Reactive Diluents Market Outlook, 2015-2030 3.1.Capacity, By Volume 3.1.1.By Country 3.2.Production 3.2.1.By Country 3.3.Operating Efficiency 3.3.1.By Country 4.North America Reactive Diluents Demand Outlook, 2015-2030, By Volume 4.1.By Type 4.2.By Application 4.3.By Country 4.4.United States Reactive Diluents Market Outlook, 2015-2030 4.4.1.Capacity, By Volume 4.4.1.1. By Company 4.4.1.2. By Location 4.4.2.Production 4.4.2.1. By Company 4.4.3.Operating Efficiency 4.4.3.1. By Company 4.4.4.United States Reactive Diluents Demand-Supply Scenario, 2015-2030, By Volume 4.4.4.1. Demand 4.4.4.2. Supply 4.4.4.3. Gap 4.4.5.United States Reactive Diluents Demand Outlook, 2015-2030, By Volume 4.4.5.1. By Type 4.4.5.2. By Application 4.4.5.3. By Company Share (At least top 3 companies’ market share) 4.4.5.4. By Region 4.4.5.5. By Sales Channel 4.5.Mexico Reactive Diluents Market Outlook, 2015-2030 4.5.1.Capacity, By Volume 4.5.1.1. By Company 4.5.1.2. By Location 4.5.2.Production 4.5.2.1. By Company 4.5.3.Operating Efficiency
4.5.3.1. 4.5.4.Mexico Reactive Diluents Demand-Supply Scenario, 2015-2030, By Volume 4.5.4.1. Demand 4.5.4.2. Supply 4.5.4.3. Gap 4.5.5.Mexico Reactive Diluents Demand Outlook, 2015-2030, By Volume 4.5.5.1. By Type 4.5.5.2. By Application 4.5.5.3. By Company Share (At least top 3 companies’ market share) 4.5.5.4. By Region 4.5.5.5. By Sales Channel 4.6.Canada Reactive Diluents Market Outlook, 2015-2030 4.6.1.Capacity, By Volume 4.6.1.1. By Company 4.6.1.2. By Location 4.6.2.Production 4.6.2.1. By Company 4.6.3.Operating Efficiency 4.6.3.1. By Company 4.6.4.Canada Reactive Diluents Demand-Supply Scenario, 2015-2030, By Volume 4.6.4.1. Demand 4.6.4.2. Supply 4.6.4.3. Gap 4.6.5.Canada Reactive Diluents Demand Outlook, 2015-2030, By Volume 4.6.5.1. By Type 4.6.5.2. By Application 4.6.5.3. By Company Share (At least top 3 companies’ market share) 4.6.5.4. By Region 4.6.5.5. By Sales Channel 5.Asia Pacific Reactive Diluents Market Outlook, 2015-2030 5.1.Capacity, By Volume 5.1.1.By Country 5.2.Production 5.2.1.By Country 5.3.Operating Efficiency 5.3.1.By Country 6.Asia Pacific Reactive Diluents Demand Outlook, 2015-2030, By Volume 6.1.By Type 6.2.By Application 6.3.By Country 6.4.China Reactive Diluents Market Outlook, 2015-2030 6.4.1.Capacity, By Volume 6.4.1.1. By Company 6.4.1.2. By Location 6.4.2.Production 6.4.2.1. By Company 6.4.3.Operating Efficiency 6.4.3.1. By Company By Company
6.4.4.China Reactive Diluents Demand-Supply Scenario, 2015-2030, By Volume 6.4.4.1. Demand 6.4.4.2. Supply 6.4.4.3. Gap 6.4.5.China Reactive Diluents Demand Outlook, 2015-2030, By Volume 6.4.5.1. By Type 6.4.5.2. By Application 6.4.5.3. By Company Share (At least top 3 companies’ market share) 6.4.5.4. By Region 6.4.5.5. By Sales Channel 6.5.India Reactive Diluents Market Outlook, 2015-2030 6.5.1.Capacity, By Volume 6.5.1.1. By Company 6.5.1.2. By Location 6.5.2.Production 6.5.2.1. By Company 6.5.3.Operating Efficiency 6.5.3.1. By Company 6.5.4.India Reactive Diluents Demand-Supply Scenario, 2015-2030, By Volume 6.5.4.1. Demand 6.5.4.2. Supply 6.5.4.3. Gap 6.5.5.India Reactive Diluents Demand Outlook, 2015-2030, By Volume 6.5.5.1. By Type 6.5.5.2. By Application 6.5.5.3. By Company Share (At least top 3 companies’ market share) 6.5.5.4. By Region 6.5.5.5. By Sales Channel 6.6.Japan Reactive Diluents Market Outlook, 2015-2030 6.6.1.Capacity, By Volume 6.6.1.1. By Company 6.6.1.2. By Location 6.6.2.Production 6.6.2.1. By Company 6.6.3.Operating Efficiency 6.6.3.1. By Company 6.6.4.Japan Reactive Diluents Demand-Supply Scenario, 2015-2030, By Volume 6.6.4.1. Demand 6.6.4.2. Supply 6.6.4.3. Gap 6.6.5.Japan Reactive Diluents Demand Outlook, 2015-2030, By Volume 6.6.5.1. By Type 6.6.5.2. By Application 6.6.5.3. By Company Share (At least top 3 companies’ market share) 6.6.5.4. By Region 6.6.5.5. By Sales Channel 6.7.South Korea Reactive Diluents Market Outlook, 2015-2030 6.7.1.Capacity, By Volume
6.7.1.1. 6.7.1.2. 6.7.2.Production 6.7.2.1. 6.7.3.Operating Efficiency 6.7.3.1. 6.7.4.South Korea Reactive Diluents Demand-Supply Scenario, 2015-2030, By Volume 6.7.4.1. Demand 6.7.4.2. Supply 6.7.4.3. Gap 6.7.5.South Korea Reactive Diluents Demand Outlook, 2015-2030, By Volume 6.7.5.1. By Type 6.7.5.2. By Application 6.7.5.3. By Company Share (At least top 3 companies’ market share) 6.7.5.4. By Region 6.7.5.5. By Sales Channel 6.8.Taiwan Reactive Diluents Market Outlook, 2015-2030 6.8.1.Capacity, By Volume 6.8.1.1. By Company 6.8.1.2. By Location 6.8.2.Production 6.8.2.1. By Company 6.8.3.Operating Efficiency 6.8.3.1. By Company 6.8.4.Taiwan Reactive Diluents Demand-Supply Scenario, 2015-2030, By Volume 6.8.4.1. Demand 6.8.4.2. Supply 6.8.4.3. Gap 6.8.5.Taiwan Reactive Diluents Demand Outlook, 2015-2030, By Volume 6.8.5.1. By Type 6.8.5.2. By Application 6.8.5.3. By Region 6.8.5.4. By Sales Channel 6.8.5.5. By Company Share (At least top 3 companies’ market share) 6.9.Singapore Reactive Diluents Market Outlook, 2015-2030 6.9.1.Capacity, By Volume 6.9.1.1. By Company 6.9.1.2. By Location 6.9.2.Production 6.9.2.1. By Company 6.9.3.Operating Efficiency 6.9.3.1. By Company 6.9.4.Singapore Reactive Diluents Demand-Supply Scenario, 2015-2030, By Volume 6.9.4.1. Demand 6.9.4.2. Supply 6.9.4.3. Gap 6.9.5.Singapore Reactive Diluents Demand Outlook, 2015-2030, By Volume 6.9.5.1. By Type By Company By Location By Company By Company
6.9.5.2. 6.9.5.3. 6.9.5.4. 6.9.5.5. By Application By Region By Sales Channel By Company Share (At least top 3 companies’ market share) 7.Europe Reactive Diluents Market Outlook, 2015-2030 7.1.Capacity, By Volume 7.1.1.By Country 7.2.Production 7.2.1.By Country 7.3.Operating Efficiency 7.3.1.By Country 8.Europe Reactive Diluents Demand Outlook, 2015-2030, By Volume 8.1.By Type 8.2.By Application 8.3.By Sales Channel (Direct/Institutional Sales, Retail Sales, Other Channel Sales) 8.4.By Country 8.5.Germany Reactive Diluents Market Outlook, 2015-2030 8.5.1.Capacity, By Volume 8.5.1.1. By Company 8.5.1.2. By Location 8.5.2.Production 8.5.2.1. By Company 8.5.3.Operating Efficiency 8.5.3.1. By Company 8.5.4.Germany Reactive Diluents Demand-Supply Scenario, 2015-2030, By Volume 8.5.4.1. Demand 8.5.4.2. Supply 8.5.4.3. Gap 8.5.5.Germany Reactive Diluents Demand Outlook, 2015-2030, By Volume 8.5.5.1. By Type 8.5.5.2. By Application 8.5.5.3. By Company Share (At least top 3 companies’ market share) 8.5.5.4. By Region 8.5.5.5. By Sales Channel 8.5.6.Belgium Reactive Diluents Market Outlook, 2015-2030 8.5.6.1. Capacity, By Volume 8.5.6.1.1. By Company 8.5.6.1.2. By Location 8.5.6.2. Production 8.5.6.2.1. By Company 8.5.6.3. Operating Efficiency 8.5.6.3.1. By Company 8.5.7.Belgium Reactive Diluents Demand-Supply Scenario, 2015-2030, By Volume 8.5.7.1. Demand 8.5.7.2. Supply 8.5.7.3. Gap 8.5.8.Belgium Reactive Diluents Demand Outlook, 2015-2030, By Volume 8.5.8.1. By Type
8.5.8.2. 8.5.8.3. 8.5.8.4. 8.5.8.5. By Application By Sales Channel By Company Share (At least top 3 companies’ market share) By Region 8.6.France Reactive Diluents Market Outlook, 2015-2030 8.6.1.Capacity, By Volume 8.6.1.1. By Company 8.6.1.2. By Location 8.6.2.Production 8.6.2.1. By Company 8.6.3.Operating Efficiency 8.6.3.1. By Company 8.6.4.France Reactive Diluents Demand-Supply Scenario, 2015-2030, By Volume 8.6.4.1. Demand 8.6.4.2. Supply 8.6.4.3. Gap 8.6.5.France Reactive Diluents Demand Outlook, 2015-2030, By Volume 8.6.5.1. By Type 8.6.5.2. By Application 8.6.5.3. By Sales Channel 8.6.5.4. By Company Share (At least top 3 companies’ market share) 8.6.5.5. By Region 8.7.United Kingdom Reactive Diluents Market Outlook, 2015-2030 8.7.1.Capacity, By Volume 8.7.1.1. By Company 8.7.1.2. By Location 8.7.2.Production 8.7.2.1. By Company 8.7.3.Operating Efficiency 8.7.3.1. By Company 8.7.4.United Kingdom Reactive Diluents Demand-Supply Scenario, 2015-2030, By Volume 8.7.4.1. Demand 8.7.4.2. Supply 8.7.4.3. Gap 8.7.5.United Kingdom Reactive Diluents Demand Outlook, 2015-2030, By Volume 8.7.5.1. By Type 8.7.5.2. By Application 8.7.5.3. By Sales Channel 8.7.5.4. By Company Share (At least top 3 companies’ market share) 8.7.5.5. By Region 8.8.Spain Reactive Diluents Market Outlook, 2015-2030 8.8.1.Capacity, By Volume 8.8.1.1. By Company 8.8.1.2. By Location 8.8.2.Production 8.8.2.1. By Company 8.8.3.Operating Efficiency 8.8.3.1. By Company
8.8.4.Spain Reactive Diluents Demand-Supply Scenario, 2015-2030, By Volume 8.8.4.1. Demand 8.8.4.2. Supply 8.8.4.3. Gap 8.8.5.Spain Reactive Diluents Demand Outlook, 2015-2030, By Volume 8.8.5.1. By Type 8.8.5.2. By Application 8.8.5.3. By Sales Channel 8.8.5.4. By Company Share (At least top 3 companies’ market share) 8.8.5.5. By Region 8.9.Italy Reactive Diluents Market Outlook, 2015-2030 8.9.1.Capacity, By Volume 8.9.1.1. By Company 8.9.1.2. By Location 8.9.2.Production 8.9.2.1. By Company 8.9.3.Operating Efficiency 8.9.3.1. By Company 8.9.4.Italy Reactive Diluents Demand-Supply Scenario, 2015-2030, By Volume 8.9.4.1. Demand 8.9.4.2. Supply 8.9.4.3. Gap 8.9.5.Italy Reactive Diluents Demand Outlook, 2015-2030, By Volume 8.9.5.1. By Type 8.9.5.2. By Application 8.9.5.3. By Sales Channel 8.9.5.4. By Company Share (At least top 3 companies’ market share) 8.9.5.5. By Region 8.10. Sweden Reactive Diluents Market Outlook, 2015-2030 8.10.1.Capacity, By Volume 8.10.1.1. By Company 8.10.1.2. By Location 8.10.2.Production 8.10.2.1. By Company 8.10.3.Operating Efficiency 8.10.3.1. By Company 8.10.4.Sweden Reactive Diluents Demand-Supply Scenario, 2015-2030, By Volume 8.10.4.1. Demand 8.10.4.2. Supply 8.10.4.3. Gap 8.10.5.Sweden Reactive Diluents Demand Outlook, 2015-2030, By Volume 8.10.5.1. By Type 8.10.5.2. By Application 8.10.5.3. By Sales Channel 8.10.5.4. By Company Share (At least top 3 companies’ market share) 8.10.5.5. By Region 8.11. Austria Reactive Diluents Market Outlook, 2015-2030 8.11.1.Capacity, By Volume
8.11.1.1. 8.11.1.2. 8.11.2.Production 8.11.2.1. 8.11.3.Operating Efficiency 8.11.3.1. 8.11.4.Austria Reactive Diluents Demand-Supply Scenario, 2015-2030, By Volume 8.11.4.1. Demand 8.11.4.2. Supply 8.11.4.3. Gap 8.11.5.Austria Reactive Diluents Demand Outlook, 2015-2030, By Volume 8.11.5.1. By Type 8.11.5.2. By Application 8.11.5.3. By Sales Channel 8.11.5.4. By Company Share (At least top 3 companies’ market share) 8.11.5.5. By Region 9.MEA Reactive Diluents Market Outlook, 2015-2030 9.1.Capacity, By Volume 9.1.1.By Country 9.2.Production 9.2.1.By Country 9.3.Operating Efficiency 9.3.1.By Country 10.MEA Reactive Diluents Demand Outlook, 2015-2030, By Volume 10.1. By Type 10.2. By Application 10.3. By Sales Channel 10.4. By Country 10.5. Saudi Arabia Reactive Diluents Market Outlook, 2015-2030 10.5.1.Capacity, By Volume 10.5.1.1. By Company 10.5.1.2. By Location 10.5.2.Production 10.5.2.1. By Company 10.5.3.Operating Efficiency 10.5.3.1. By Company 10.5.4.Saudi Arabia Reactive Diluents Demand-Supply Scenario, 2015-2030, By Volume 10.5.4.1. Demand 10.5.4.2. Supply 10.5.4.3. Gap 10.5.5.Saudi Arabia Reactive Diluents Demand Outlook, 2015-2030, By Volume 10.5.5.1. By Type 10.5.5.2. By Application 10.5.5.3. By Sales Channel 10.5.5.4. By Company Share (At least top 3 companies’ market share) 10.5.5.5. By Region 10.6. Iran Reactive Diluents Market Outlook, 2015-2030 10.6.1.Capacity, By Volume By Company By Location By Company By Company
10.6.1.1. 10.6.1.2. 10.6.2.Production 10.6.2.1. 10.6.3.Operating Efficiency 10.6.3.1. 10.6.4.Iran Reactive Diluents Demand-Supply Scenario, 2015-2030, By Volume 10.6.4.1. Demand 10.6.4.2. Supply 10.6.4.3. Gap 10.6.5.Iran Reactive Diluents Demand Outlook, 2015-2030, By Volume 10.6.5.1. By Type 10.6.5.2. By Application 10.6.5.3. By Sales Channel 10.6.5.4. By Company Share (At least top 3 companies’ market share) 10.6.5.5. By Region 10.7. South Africa Reactive Diluents Market Outlook, 2015-2030 10.7.1.Capacity, By Volume 10.7.1.1. By Company 10.7.1.2. By Location 10.7.2.Production 10.7.2.1. By Company 10.7.3.Operating Efficiency 10.7.3.1. By Company 10.7.4.South Africa Reactive Diluents Demand-Supply Scenario, 2015-2030, By Volume 10.7.4.1. Demand 10.7.4.2. Supply 10.7.4.3. Gap 10.7.5.South Africa Reactive Diluents Demand Outlook, 2015-2030, By Volume 10.7.5.1. By Type 10.7.5.2. By Application 10.7.5.3. By Sales Channel 10.7.5.4. By Company Share (At least top 3 companies’ market share) 10.7.5.5. By Region 11.South America Reactive Diluents Market Outlook, 2015-2030 11.1. Capacity, By Volume 11.1.1.By Country 11.2. Production 11.2.1.By Country 11.3. Operating Efficiency 11.3.1.By Country 12.South America Reactive Diluents Demand Outlook, 2015-2030, By Volume 12.1. By Type 12.2. By Application 12.3. By Sales Channel (Direct/Institutional Sales, Retail Sales, Other Channel Sales) 12.4. By Company Share (At least top 3 companies’ market share) 12.5. By Country 12.6. Brazil Reactive Diluents Market Outlook, 2015-2030 By Company By Location By Company By Company
12.6.1.Capacity, By Volume 12.6.1.1. 12.6.1.2. 12.6.2.Production 12.6.2.1. 12.6.3.Operating Efficiency 12.6.3.1. 12.6.4.Brazil Reactive Diluents Demand-Supply Scenario, 2015-2030, By Volume 12.6.4.1. Demand 12.6.4.2. Supply 12.6.4.3. Gap 12.6.5.Brazil Reactive Diluents Demand Outlook, 2015-2030, By Volume 12.6.5.1. By Type 12.6.5.2. By Application 12.6.5.3. By Sales Channel 12.6.5.4. By Company Share (At least top 3 companies’ market share) 12.6.5.5. By Region 12.7. Argentina Reactive Diluents Market Outlook, 2015-2030 12.7.1.Capacity, By Volume 12.7.1.1. By Company 12.7.1.2. By Location 12.7.2.Production 12.7.2.1. By Company 12.7.3.Operating Efficiency 12.7.3.1. By Company 12.7.4.Argentina Reactive Diluents Demand-Supply Scenario, 2015-2030, By Volume 12.7.4.1. Demand 12.7.4.2. Supply 12.7.4.3. Gap 12.7.5.Argentina Reactive Diluents Demand Outlook, 2015-2030, By Volume 12.7.5.1. By Type 12.7.5.2. By Application 12.7.5.3. By Sales Channel 12.7.5.4. By Company Share (At least top 3 companies’ market share) 13.By Region 14.Country-wise Import 15.Country-wise Export 16.News and Deals By Company By Location By Company By Company About Us ChemAnalyst is a leading provider of chemical commodity prices in more than 12 countries from last 4 Years. The company has emerged as a preferred pricing supplier amongst Procurement Managers and Strategy Professionals globally who wants to track near real time prices of chemicals on its interactive dashboard. Unlike most of its competitors such as ICIS, IHS & S&P Platts the company doesn’t believe in delivering prices in PDF reports. The company has developed proprietary algorithm based online subscription platform in which users can track years of historical prices of more than 250 chemical commodities. In addition, since it’s all online, the users cannot just compare prices across multiple countries but also with other commodities and play with the data by generating multiple
graphs to find out amazing insights. The users get access to grade wise CIF, CFR & Ex Works prices at multiple ports in each country. ChemAnalyst also provides market analysis for more than 1000+ chemical commodities such as Production, Demand, Supply, Plant Operating Rate, Imports, Exports, Suppliers, Customers and much more. The company has created online interactive dashboard in which customers can access all this data instantly with a click of a button. The users will not only be able to analyse historical data for past years but will also get to analyse short term and long-term forecasts for coming years. With the access to local field teams, the company can provide high quality reliable market analysis data for more than 20 countries. ChemAnalyst is a one stop solution for all the data related needs. We at ChemAnalyst are committed to assist customers worldwide with their data and insights needs using our comprehensive online platform. For more information, please visit us at www.chemanalyst.com Contact Us: Nilesh Vishwakarma B-44 Sector-57 Noida, National Capital Region Tel: 0120-4523948 Mob: +91-8882336899 Email: info@chemanalyst.com