Download

1 / 14
140 likes | 158 Views
Mining Chemicals find application in mineral processing and treatment of wastewater generated during mining operations. The increasing need for specialty chemicals in mining operations coupled with the growing number of mining operations globally due to the increasing demand for minerals and precious metals is expected to drive the demand for Mining Chemicals during the forecast period.

E N D
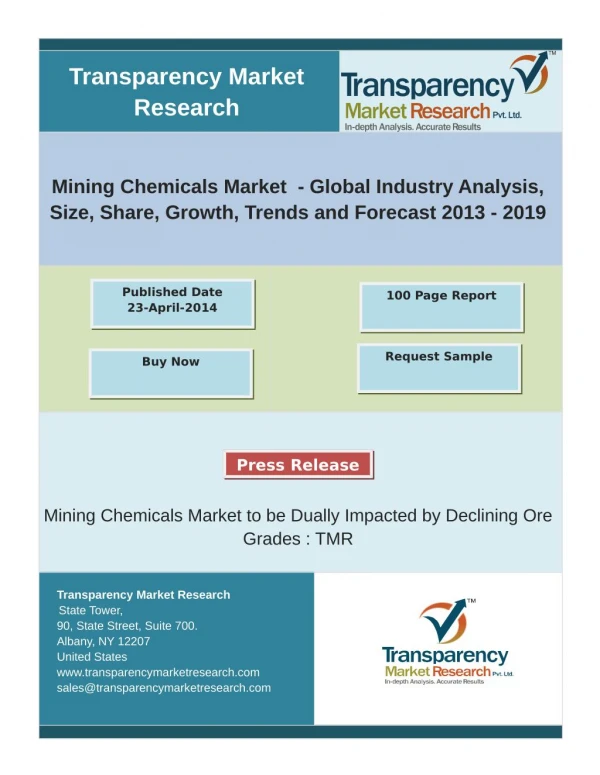
Mining Chemicals Market Analysis: Plant Capacity, Production, Operating Efficiency, Demand & Supply, End-User Industries, Distribution Channel, Regional Demand, 2015-2030 [Online Quarterly Update] Mining Chemicals demand stood at 2.275 million Tonnes in 2020 and is forecast to reach 3.99 million Tonnes by 2030, growing at a healthy CAGR of 5.85% until 2030. Mining Chemicals are specialty chemicals used in mining operations. These chemicals are of various types depending upon the function they are used to carry out. Mining Chemicals include flotation chemicals which further include collectors, depressants, flocculants, frothers, dispersants, extraction chemicals. Extraction chemicals are further classified into diluents and extractants and grinding aids. Mining Chemicals find application in mineral processing and treatment of wastewater generated during mining operations. The increasing need for specialty chemicals in mining operations coupled with the growing number of mining operations globally due to the increasing demand for minerals and precious metals is expected to drive the demand for Mining Chemicals during the forecast period. Moreover, increasing mining operations in Africa, North America are expected to push the demand further during the forecast period. Stringent environmental regulations regarding Mining Chemicals are expected to hinder demand growth during the forecast period. Read Full Report Here: https://www.chemanalyst.com/industry-report/mining-chemicals-market- 592 In 2020, the spread of COVID-19 in major global economies caused nationwide lockdowns which had an impact on several industries. Mining was among the most affected industries during the pandemic. This had an impact on the demand for Mining Chemicals for the first half of 2020. Therefore, the demand for these chemicals fell during the coronavirus pandemic from the mineral processing segment. However, in the latter half of 2020, after the resumption of the mining activities, an improvement in the demand for Mining Chemicals was witnessed and is anticipated to propel the growth of the Mining Chemicals market in the forecast period.
Years considered for this report: Historical Period: 2015-2019 Base Year: 2020 Estimated Year: 2021 Forecast Period: 2022–2030 This report will be delivered on an online digital platform with one-year subscription and quarterly update. Objective of the Study: • To assess the demand-supply scenario of Mining Chemicals which covers production, demand and supply of Mining Chemicals market globally. To analyse and forecast the market size of Mining Chemicals. To classify and forecast global Mining Chemicals market based on technology, end-use and regional distribution. To identify drivers and challenges for global Mining Chemicals market. To examine competitive developments such as expansions, new product launches, mergers & acquisitions, etc., in global Mining Chemicals market. To identify and analyse the profile of leading players involved in the manufacturing of mining chemicals. • • • • • Report Scope: In this report, global Mining Chemicals market has been segmented into following categories, in addition to the industry trends which have also been detailed below:
Attribute Details 2.275 million Tonnes Market size volume in 2020 3.99 million Tonnes Market size volume in 2030 Growth Rate CAGR of 5.85% from 2021 to 2030 2020 Base estimation year for Historic Data 2015 – 2019 Forecast period 2022 – 2030 Quantitative units Demand in tons and CAGR from 2021 to 2030 Report coverage Revenue forecast, demand & supply, competitive analysis, competitive landscape, growth factors, and trends Segments covered 1. Application: (Mineral Processing, Wastewater Treatment) 2. Type: (Flotation Chemicals, Extraction Chemicals, Grinding Aids) 3. Sales Channel: (Direct/Institutional Sales, Indirect Sales) Regional scope North America; Europe; Asia Pacific; South America; Middle East & Africa Country scope United States; Mexico; Canada; China; India; Japan; South Korea; Taiwan; Singapore; Germany; Belgium; France; United Kingdom; Spain; Italy; Sweden; Austria; Saudi Arabia; Iran; South Africa; Brazil; Argentina Key profiled companies 3M, Arkema, Betachem (Pty) Ltd, Clariant AG, CTC Mining (Tennant Chemicals Company Limited), FMC Corporation, Kemira, Orica Limited, Sasol, Solvay, The Chemours Company, BASF SE, Chevron Phillips Chemicals Co. Ltd, CP Kelco US Inc., Ecolab. Customization scope Free report customization with purchase. Addition or alteration to country, regional & segment scope. Pricing purchase options and Avail customized purchase options to meet your exact research needs.Explore purchase options To extract data for global Mining Chemicals market, primary research surveys were conducted with Mining Chemicals manufacturers, suppliers, distributors, wholesalers and end users. While interviewing, the respondents were also inquired about their competitors. Through this technique, ChemAnalyst was able to include manufacturers that could not be identified due to the limitations of secondary research. Moreover, ChemAnalyst analyzed various end user segments and projected a positive outlook for Global Mining Chemicals market over the coming years. ChemAnalyst calculated Mining Chemicals demand globally by analyzing the historical data and demand forecast which was carried out considering imported mining chemicals, prices, materials used for production of Mining Chemicals. ChemAnalyst sourced these values from industry experts and company representatives and externally validated through analyzing historical sales data of respective manufacturers to arrive at the overall market size. Various secondary sources such as company websites, association reports, annual reports, etc., were also studied by ChemAnalyst.
Key Target Audience: Mining Chemicals manufacturers and other stakeholders Organizations, forums, and alliances related to Mining Chemicals distribution Government bodies such as regulating authorities and policy makers Market research organizations and consulting companies • • • • The study is useful in providing answers to several critical questions that are important for industry stakeholders such as Mining Chemicals manufacturers, customers, and policy makers. The study would also help them to target the growing segments over the coming years (next two to five years), thereby aiding the stakeholders in taking investment decisions and facilitating their expansion. TABLE OF CONTENTS: 1.Global Mining Chemicals Market Outlook, 2015-2030 1.1.Capacity, By Volume 1.1.1.By Company 1.2.Production, By Volume 1.2.1.By Company 1.3.Operating Efficiency 1.3.1.By Company 2.Global Mining Chemicals Demand Outlook, 2015-2030, By Volume 2.1.By Type 2.2.By Application 2.3.By Region 2.4.By Company 3.North America Mining Chemicals Market Outlook, 2015-2030 3.1.Capacity, By Volume 3.1.1.By Country 3.2.Production 3.2.1.By Country 3.3.Operating Efficiency 3.3.1.By Country 4.North America Mining Chemicals Demand Outlook, 2015-2030, By Volume 4.1.By Type 4.2.By Application 4.3.By Country 4.4.United States Mining Chemicals Market Outlook, 2015-2030 4.4.1.Capacity, By Volume 4.4.1.1. By Company 4.4.1.2. By Location 4.4.2.Production 4.4.2.1. By Company 4.4.3.Operating Efficiency 4.4.3.1. By Company 4.4.4.United States Mining Chemicals Demand-Supply Scenario, 2015-2030, By Volume 4.4.4.1. Demand 4.4.4.2. Supply 4.4.4.3. Gap
4.4.5.United States Mining Chemicals Demand Outlook, 2015-2030, By Volume 4.4.5.1. By Type 4.4.5.2. By Application 4.4.5.3. By Company Share (At least top 3 companies’ market share) 4.4.5.4. By Region 4.4.5.5. By Sales Channel 4.5.Mexico Mining Chemicals Market Outlook, 2015-2030 4.5.1.Capacity, By Volume 4.5.1.1. By Company 4.5.1.2. By Location 4.5.2.Production 4.5.2.1. By Company 4.5.3.Operating Efficiency 4.5.3.1. By Company 4.5.4.Mexico Mining Chemicals Demand-Supply Scenario, 2015-2030, By Volume 4.5.4.1. Demand 4.5.4.2. Supply 4.5.4.3. Gap 4.5.5.Mexico Mining Chemicals Demand Outlook, 2015-2030, By Volume 4.5.5.1. By Type 4.5.5.2. By Application 4.5.5.3. By Company Share (At least top 3 companies’ market share) 4.5.5.4. By Region 4.5.5.5. By Sales Channel 4.6.Canada Mining Chemicals Market Outlook, 2015-2030 4.6.1.Capacity, By Volume 4.6.1.1. By Company 4.6.1.2. By Location 4.6.2.Production 4.6.2.1. By Company 4.6.3.Operating Efficiency 4.6.3.1. By Company 4.6.4.Canada Mining Chemicals Demand-Supply Scenario, 2015-2030, By Volume 4.6.4.1. Demand 4.6.4.2. Supply 4.6.4.3. Gap 4.6.5.Canada Mining Chemicals Demand Outlook, 2015-2030, By Volume 4.6.5.1. By Type 4.6.5.2. By Application 4.6.5.3. By Company Share (At least top 3 companies’ market share) 4.6.5.4. By Region 4.6.5.5. By Sales Channel 5.Asia Pacific Mining Chemicals Market Outlook, 2015-2030 5.1.Capacity, By Volume 5.1.1.By Country 5.2.Production 5.2.1.By Country 5.3.Operating Efficiency 5.3.1.By Country 6.Asia Pacific Mining Chemicals Demand Outlook, 2015-2030, By Volume 6.1.By Type 6.2.By Application 6.3.By Country
6.4.China Mining Chemicals Market Outlook, 2015-2030 6.4.1.Capacity, By Volume 6.4.1.1. By Company 6.4.1.2. By Location 6.4.2.Production 6.4.2.1. By Company 6.4.3.Operating Efficiency 6.4.3.1. By Company 6.4.4.China Mining Chemicals Demand-Supply Scenario, 2015-2030, By Volume 6.4.4.1. Demand 6.4.4.2. Supply 6.4.4.3. Gap 6.4.5.China Mining Chemicals Demand Outlook, 2015-2030, By Volume 6.4.5.1. By Type 6.4.5.2. By Application 6.4.5.3. By Company Share (At least top 3 companies’ market share) 6.4.5.4. By Region 6.4.5.5. By Sales Channel 6.5.India Mining Chemicals Market Outlook, 2015-2030 6.5.1.Capacity, By Volume 6.5.1.1. By Company 6.5.1.2. By Location 6.5.2.Production 6.5.2.1. By Company 6.5.3.Operating Efficiency 6.5.3.1. By Company 6.5.4.India Mining Chemicals Demand-Supply Scenario, 2015-2030, By Volume 6.5.4.1. Demand 6.5.4.2. Supply 6.5.4.3. Gap 6.5.5.India Mining Chemicals Demand Outlook, 2015-2030, By Volume 6.5.5.1. By Type 6.5.5.2. By Application 6.5.5.3. By Company Share (At least top 3 companies’ market share) 6.5.5.4. By Region 6.5.5.5. By Sales Channel 6.6.Japan Mining Chemicals Market Outlook, 2015-2030 6.6.1.Capacity, By Volume 6.6.1.1. By Company 6.6.1.2. By Location 6.6.2.Production 6.6.2.1. By Company 6.6.3.Operating Efficiency 6.6.3.1. By Company 6.6.4.Japan Mining Chemicals Demand-Supply Scenario, 2015-2030, By Volume 6.6.4.1. Demand 6.6.4.2. Supply 6.6.4.3. Gap 6.6.5.Japan Mining Chemicals Demand Outlook, 2015-2030, By Volume 6.6.5.1. By Type 6.6.5.2. By Application 6.6.5.3. By Company Share (At least top 3 companies’ market share) 6.6.5.4. By Region
6.6.5.5. By Sales Channel 6.7.South Korea Mining Chemicals Market Outlook, 2015-2030 6.7.1.Capacity, By Volume 6.7.1.1. By Company 6.7.1.2. By Location 6.7.2.Production 6.7.2.1. By Company 6.7.3.Operating Efficiency 6.7.3.1. By Company 6.7.4.South Korea Mining Chemicals Demand-Supply Scenario, 2015-2030, By Volume 6.7.4.1. Demand 6.7.4.2. Supply 6.7.4.3. Gap 6.7.5.South Korea Mining Chemicals Demand Outlook, 2015-2030, By Volume 6.7.5.1. By Type 6.7.5.2. By Application 6.7.5.3. By Company Share (At least top 3 companies’ market share) 6.7.5.4. By Region 6.7.5.5. By Sales Channel 6.8.Taiwan Mining Chemicals Market Outlook, 2015-2030 6.8.1.Capacity, By Volume 6.8.1.1. By Company 6.8.1.2. By Location 6.8.2.Production 6.8.2.1. By Company 6.8.3.Operating Efficiency 6.8.3.1. By Company 6.8.4.Taiwan Mining Chemicals Demand-Supply Scenario, 2015-2030, By Volume 6.8.4.1. Demand 6.8.4.2. Supply 6.8.4.3. Gap 6.8.5.Taiwan Mining Chemicals Demand Outlook, 2015-2030, By Volume 6.8.5.1. By Type 6.8.5.2. By Application 6.8.5.3. By Region 6.8.5.4. By Sales Channel 6.8.5.5. By Company Share (At least top 3 companies’ market share) 6.9.Singapore Mining Chemicals Market Outlook, 2015-2030 6.9.1.Capacity, By Volume 6.9.1.1. By Company 6.9.1.2. By Location 6.9.2.Production 6.9.2.1. By Company 6.9.3.Operating Efficiency 6.9.3.1. By Company 6.9.4.Singapore Mining Chemicals Demand-Supply Scenario, 2015-2030, By Volume 6.9.4.1. Demand 6.9.4.2. Supply 6.9.4.3. Gap 6.9.5.Singapore Mining Chemicals Demand Outlook, 2015-2030, By Volume 6.9.5.1. By Type 6.9.5.2. By Application 6.9.5.3. By Region
6.9.5.4. 6.9.5.5. By Sales Channel By Company Share (At least top 3 companies’ market share) 7.Europe Mining Chemicals Market Outlook, 2015-2030 7.1.Capacity, By Volume 7.1.1.By Country 7.2.Production 7.2.1.By Country 7.3.Operating Efficiency 7.3.1.By Country 8.Europe Mining Chemicals Demand Outlook, 2015-2030, By Volume 8.1.By Type 8.2.By Application 8.3.By Sales Channel (Direct/Institutional Sales, Retail Sales, Other Channel Sales) 8.4.By Country 8.5.Germany Mining Chemicals Market Outlook, 2015-2030 8.5.1.Capacity, By Volume 8.5.1.1. By Company 8.5.1.2. By Location 8.5.2.Production 8.5.2.1. By Company 8.5.3.Operating Efficiency 8.5.3.1. By Company 8.5.4.Germany Mining Chemicals Demand-Supply Scenario, 2015-2030, By Volume 8.5.4.1. Demand 8.5.4.2. Supply 8.5.4.3. Gap 8.5.5.Germany Mining Chemicals Demand Outlook, 2015-2030, By Volume 8.5.5.1. By Type 8.5.5.2. By Application 8.5.5.3. By Company Share (At least top 3 companies’ market share) 8.5.5.4. By Region 8.5.5.5. By Sales Channel 8.5.6.Belgium Mining Chemicals Market Outlook, 2015-2030 8.5.6.1. Capacity, By Volume 8.5.6.1.1. By Company 8.5.6.1.2. By Location 8.5.6.2. Production 8.5.6.2.1. By Company 8.5.6.3. Operating Efficiency 8.5.6.3.1. By Company 8.5.7.Belgium Mining Chemicals Demand-Supply Scenario, 2015-2030, By Volume 8.5.7.1. Demand 8.5.7.2. Supply 8.5.7.3. Gap 8.5.8.Belgium Mining Chemicals Demand Outlook, 2015-2030, By Volume 8.5.8.1. By Type 8.5.8.2. By Application 8.5.8.3. By Sales Channel 8.5.8.4. By Company Share (At least top 3 companies’ market share) 8.5.8.5. By Region 8.6.France Mining Chemicals Market Outlook, 2015-2030 8.6.1.Capacity, By Volume 8.6.1.1. By Company
8.6.1.2. By Location 8.6.2.Production 8.6.2.1. 8.6.3.Operating Efficiency 8.6.3.1. 8.6.4.France Mining Chemicals Demand-Supply Scenario, 2015-2030, By Volume 8.6.4.1. Demand 8.6.4.2. Supply 8.6.4.3. Gap 8.6.5.France Mining Chemicals Demand Outlook, 2015-2030, By Volume 8.6.5.1. By Type 8.6.5.2. By Application 8.6.5.3. By Sales Channel 8.6.5.4. By Company Share (At least top 3 companies’ market share) 8.6.5.5. By Region 8.7.United Kingdom Mining Chemicals Market Outlook, 2015-2030 8.7.1.Capacity, By Volume 8.7.1.1. By Company 8.7.1.2. By Location 8.7.2.Production 8.7.2.1. By Company 8.7.3.Operating Efficiency 8.7.3.1. By Company 8.7.4.United Kingdom Mining Chemicals Demand-Supply Scenario, 2015-2030, By Volume 8.7.4.1. Demand 8.7.4.2. Supply 8.7.4.3. Gap 8.7.5.United Kingdom Mining Chemicals Demand Outlook, 2015-2030, By Volume 8.7.5.1. By Type 8.7.5.2. By Application 8.7.5.3. By Sales Channel 8.7.5.4. By Company Share (At least top 3 companies’ market share) 8.7.5.5. By Region 8.8.Spain Mining Chemicals Market Outlook, 2015-2030 8.8.1.Capacity, By Volume 8.8.1.1. By Company 8.8.1.2. By Location 8.8.2.Production 8.8.2.1. By Company 8.8.3.Operating Efficiency 8.8.3.1. By Company 8.8.4.Spain Mining Chemicals Demand-Supply Scenario, 2015-2030, By Volume 8.8.4.1. Demand 8.8.4.2. Supply 8.8.4.3. Gap 8.8.5.Spain Mining Chemicals Demand Outlook, 2015-2030, By Volume 8.8.5.1. By Type 8.8.5.2. By Application 8.8.5.3. By Sales Channel 8.8.5.4. By Company Share (At least top 3 companies’ market share) 8.8.5.5. By Region 8.9.Italy Mining Chemicals Market Outlook, 2015-2030 8.9.1.Capacity, By Volume By Company By Company
8.9.1.1. 8.9.1.2. By Company By Location 8.9.2.Production 8.9.2.1. 8.9.3.Operating Efficiency 8.9.3.1. 8.9.4.Italy Mining Chemicals Demand-Supply Scenario, 2015-2030, By Volume 8.9.4.1. Demand 8.9.4.2. Supply 8.9.4.3. Gap 8.9.5.Italy Mining Chemicals Demand Outlook, 2015-2030, By Volume 8.9.5.1. By Type 8.9.5.2. By Application 8.9.5.3. By Sales Channel 8.9.5.4. By Company Share (At least top 3 companies’ market share) 8.9.5.5. By Region 8.10. Sweden Mining Chemicals Market Outlook, 2015-2030 8.10.1.Capacity, By Volume 8.10.1.1. By Company 8.10.1.2. By Location 8.10.2.Production 8.10.2.1. By Company 8.10.3.Operating Efficiency 8.10.3.1. By Company 8.10.4.Sweden Mining Chemicals Demand-Supply Scenario, 2015-2030, By Volume 8.10.4.1. Demand 8.10.4.2. Supply 8.10.4.3. Gap 8.10.5.Sweden Mining Chemicals Demand Outlook, 2015-2030, By Volume 8.10.5.1. By Type 8.10.5.2. By Application 8.10.5.3. By Sales Channel 8.10.5.4. By Company Share (At least top 3 companies’ market share) 8.10.5.5. By Region 8.11. Austria Mining Chemicals Market Outlook, 2015-2030 8.11.1.Capacity, By Volume 8.11.1.1. By Company 8.11.1.2. By Location 8.11.2.Production 8.11.2.1. By Company 8.11.3.Operating Efficiency 8.11.3.1. By Company 8.11.4.Austria Mining Chemicals Demand-Supply Scenario, 2015-2030, By Volume 8.11.4.1. Demand 8.11.4.2. Supply 8.11.4.3. Gap 8.11.5.Austria Mining Chemicals Demand Outlook, 2015-2030, By Volume 8.11.5.1. By Type 8.11.5.2. By Application 8.11.5.3. By Sales Channel 8.11.5.4. By Company Share (At least top 3 companies’ market share) 8.11.5.5. By Region 9.MEA Mining Chemicals Market Outlook, 2015-2030 By Company By Company
9.1.Capacity, By Volume 9.1.1.By Country 9.2.Production 9.2.1.By Country 9.3.Operating Efficiency 9.3.1.By Country 10.MEA Mining Chemicals Demand Outlook, 2015-2030, By Volume 10.1. By Type 10.2. By Application 10.3. By Sales Channel 10.4. By Country 10.5. Saudi Arabia Mining Chemicals Market Outlook, 2015-2030 10.5.1.Capacity, By Volume 10.5.1.1. By Company 10.5.1.2. By Location 10.5.2.Production 10.5.2.1. By Company 10.5.3.Operating Efficiency 10.5.3.1. By Company 10.5.4.Saudi Arabia Mining Chemicals Demand-Supply Scenario, 2015-2030, By Volume 10.5.4.1. Demand 10.5.4.2. Supply 10.5.4.3. Gap 10.5.5.Saudi Arabia Mining Chemicals Demand Outlook, 2015-2030, By Volume 10.5.5.1. By Type 10.5.5.2. By Application 10.5.5.3. By Sales Channel 10.5.5.4. By Company Share (At least top 3 companies’ market share) 10.5.5.5. By Region 10.6. Iran Mining Chemicals Market Outlook, 2015-2030 10.6.1.Capacity, By Volume 10.6.1.1. By Company 10.6.1.2. By Location 10.6.2.Production 10.6.2.1. By Company 10.6.3.Operating Efficiency 10.6.3.1. By Company 10.6.4.Iran Mining Chemicals Demand-Supply Scenario, 2015-2030, By Volume 10.6.4.1. Demand 10.6.4.2. Supply 10.6.4.3. Gap 10.6.5.Iran Mining Chemicals Demand Outlook, 2015-2030, By Volume 10.6.5.1. By Type 10.6.5.2. By Application 10.6.5.3. By Sales Channel 10.6.5.4. By Company Share (At least top 3 companies’ market share) 10.6.5.5. By Region 10.7. South Africa Mining Chemicals Market Outlook, 2015-2030 10.7.1.Capacity, By Volume 10.7.1.1. By Company 10.7.1.2. By Location 10.7.2.Production 10.7.2.1. By Company
10.7.3.Operating Efficiency 10.7.3.1. 10.7.4.South Africa Mining Chemicals Demand-Supply Scenario, 2015-2030, By Volume 10.7.4.1. Demand 10.7.4.2. Supply 10.7.4.3. Gap 10.7.5.South Africa Mining Chemicals Demand Outlook, 2015-2030, By Volume 10.7.5.1. By Type 10.7.5.2. By Application 10.7.5.3. By Sales Channel 10.7.5.4. By Company Share (At least top 3 companies’ market share) 10.7.5.5. By Region 11.South America Mining Chemicals Market Outlook, 2015-2030 11.1. Capacity, By Volume 11.1.1.By Country 11.2. Production 11.2.1.By Country 11.3. Operating Efficiency 11.3.1.By Country 12.South America Mining Chemicals Demand Outlook, 2015-2030, By Volume 12.1. By Type 12.2. By Application 12.3. By Sales Channel (Direct/Institutional Sales, Retail Sales, Other Channel Sales) 12.4. By Company Share (At least top 3 companies’ market share) 12.5. By Country 12.6. Brazil Mining Chemicals Market Outlook, 2015-2030 12.6.1.Capacity, By Volume 12.6.1.1. By Company 12.6.1.2. By Location 12.6.2.Production 12.6.2.1. By Company 12.6.3.Operating Efficiency 12.6.3.1. By Company 12.6.4.Brazil Mining Chemicals Demand-Supply Scenario, 2015-2030, By Volume 12.6.4.1. Demand 12.6.4.2. Supply 12.6.4.3. Gap 12.6.5.Brazil Mining Chemicals Demand Outlook, 2015-2030, By Volume 12.6.5.1. By Type 12.6.5.2. By Application 12.6.5.3. By Sales Channel 12.6.5.4. By Company Share (At least top 3 companies’ market share) 12.6.5.5. By Region 12.7. Argentina Mining Chemicals Market Outlook, 2015-2030 12.7.1.Capacity, By Volume 12.7.1.1. By Company 12.7.1.2. By Location 12.7.2.Production 12.7.2.1. By Company 12.7.3.Operating Efficiency 12.7.3.1. By Company 12.7.4.Argentina Mining Chemicals Demand-Supply Scenario, 2015-2030, By Volume 12.7.4.1. Demand By Company
12.7.4.2. 12.7.4.3. 12.7.5.Argentina Mining Chemicals Demand Outlook, 2015-2030, By Volume 12.7.5.1. By Type 12.7.5.2. By Application 12.7.5.3. By Sales Channel 12.7.5.4. By Company Share (At least top 3 companies’ market share) 13.By Region 14.Country-wise Import 15.Country-wise Export 16.News and Deals Supply Gap About Us: ChemAnalyst is a leading provider of chemical commodity prices in more than 12 countries since from last 4 Years. The company has emerged as a preferred pricing supplier amongst Procurement Managers and Strategy Professionals globally who wants to track near real time prices of chemicals on its interactive dashboard. Unlike most of its competitors such as ICIS, IHS & S&P Platts the company doesn’t believe in delivering prices in PDF reports. The company has developed proprietary algorithm based online subscription platform in which users can track years of historical prices of more than 250 chemical commodities. In addition, since it’s all online, the users cannot just compare prices across multiple countries but also with other commodities and play with the data by generating multiple graphs to find out amazing insights. The users get access to grade wise CIF, CFR & Ex Works prices at multiple ports in each country. ChemAnalyst also provides market analysis for more than 1000+ chemical commodities such as Production, Demand, Supply, Plant Operating Rate, Imports, Exports, Suppliers, Customers and much more. The company has created online interactive dashboard in which customers can access all this data instantly with a click of a button. The users will not only be able to analyse historical data for past years but will also get to analyse short term and long-term forecasts for coming years. With the access to local field teams, the company can provide high quality reliable market analysis data for more than 20 countries. ChemAnalyst is a one stop solution for all the data related needs. We at ChemAnalyst are committed to assist customers worldwide with their data and insights needs using our comprehensive online platform. For more information, please visit us at www.chemanalyst.com Contact Us: Nilesh Vishwakarma B-44 Sector-57 Noida, National Capital Region Tel: 0120-4523948 Mob: +91-8882336899