Download
1 / 138
1.43k likes | 2.55k Views
Design For Robustness. MPD575 DFX Jonathan Weaver. Development History. Originally developed by Cohort 1 students: Steve Borkes, Larry Liotino, Dennis Person (Fall 2000) Revised by Cohort 1 students: Tom Boettcher, Al Figlioli, and John Rinke (Fall 2000). Design for Ergonomics (DFE).

E N D
Design For Robustness MPD575 DFX Jonathan Weaver
Development History • Originally developed by Cohort 1 students: Steve Borkes, Larry Liotino, Dennis Person (Fall 2000) • Revised by Cohort 1 students: Tom Boettcher, Al Figlioli, and John Rinke (Fall 2000)
Design for Ergonomics (DFE) Design for Reuse and Recycle-ability (DFRR) Design for Craftsmanship (DFC) Design for NVH (DFN) Design for Assembly (DFA) The World of Robustness Design for Environmental Friendliness (DFEF) Design for Manufacturing (DFM) Design for Cast and Molded Parts (DFCMP) Design for Serviceability (DFS) Design for Health and Safety (DFHS)
Design for Robustness (DFR) • Introduction to DFR • DFR Timing • DFR Key Principles and Procedures • Robustness Case Studies • DFR Software • Conclusions • References
Exciting & Innovative Products Customer Satisfaction and Owner Loyalty Superior Purchase & Service Experience High Product Quality TGRTGW Elements of Quality
Introduction to DFR • DFR is a key enabler for: • Design for Quality • Design for Reliability • Robust System Design • Design for Six Sigma
Robustness Defined Robustness is: The capability of a product or process to perform its intended function consistently in the presence of noise during its expected life That is, the performance of the product or process is insensitive to sources of variability
Robustness Defined Sources of variability, or “noises”, can be grouped in the following categories: • Manufacturing Variation • Wear-out/Fatigue • Customer Usage • External Environment • System Interactions
Robustness Defined • The premise of robust design is that a product that performs its function "on target" will generate the smallest loss to the customer and the producer (e.g., cost to repair or replace, cost of customer dissatisfaction). As a product deviates from its target response or expected output, cost will begin to accrue in one way or another • Customers tend to be more satisfied with their purchases if the product is robust and reliable
Robustness Defined • Robustness requires a shift from "What is wrong and how do we fix it?" way of thinking to "What is the intent and how do we maximize it?" [Dr. Genichi Taguchi] • Instead of trying to control, compensate, or eliminate usage variations, robustness attempts to make the system insensitive to usage variations. [Dr. Genichi Taguchi]
Introduction to DFR • Designing for Robustness is not new…it is just good engineering • The principles of robustness are not new concepts, but the DFR process facilitates the engineer in applying an engineering process to obtain a robust productand a means for quantifying the benefits
Why To Apply DFR? • Develop products or processes that are robust against different sources of variation • Promote proactive problem solving techniques • Avoid“build-test-fix” iterations, especially when combined with CAE methods • Achieving proactive robust designs at the subsystem level will help to better achieve robust system level performance once integrated
Why To Apply DFR? • Address new technology or existing technology in new environments • Address a component or sub-system that is part of a complex system • Gain an understanding of a system’s sensitivity to noises • Meet the global challenge of producing products that perform well in all markets
Customer Benefits: Increased customer satisfaction Added value for the customer High product quality and reliability Long term durability. Reduced cost of ownership Lower maintenance cost Higher residual values Corporate Benefits: Lower warranty Lower cost components Lower manufacturing costs Higher productivity Higher profit Improved customer loyalty Low cost producer Increased Shareholder Value Why To Apply DFR?
Introduction to DFR • DFR is not intended only for designing components or products • The techniques can be used for other systems, such as manufacturing processes, organizational structures, and product distribution networks
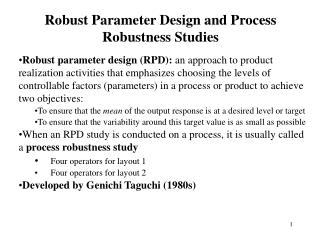
Terminology & Concepts • Reliability: the probability that a component or system will achieve a certain defined life • Concept Design: involves selecting the appropriate level of technology required to provide a particular function. • Parameter Design: involves using the DOE method to study the effect of control factors on a response in the presence of noise. • Tolerance Design: shares many of the same principles as Parameter Design; the focus is on determining different tolerances of control factors necessary for a product to deliver its intended function cost effectively.
Terminology & Concepts • A p-diagram is a common way to represent a system:
Parameter(P)-Diagram Parameters which influence system variability, but are difficult, expensive or impossible to control Noise Factors System Function Output Response Input Signal Error States Control Factors Parameters whose nominal values can be adjusted by the engineer, ideally with minimal impact on cost
Terminology & Concepts • Ideal Function: is the primary intended function of the design (often energy related, because mechanical engineering is about making things move or stopping things from moving). • Signal Factor: is the energy which is put into the engineering system (either by the customer, or by a neighboring system) to make it work.
Terminology & Concepts • Control Factors: are features of the design that can be changed by the engineer (e.g. dimensions, shapes, materials, positions, locations etc). • Noise Factors: are sources of disturbing influences that can disrupt ideal function , causing error states which lead to quality problems. • Error state: is an undesirable output of the engineering system (we can also call these failure modes), characterized by - variation in ideal function (soft failure), - degradation in ideal function (soft failure), - or loss of ideal function (hard failure).
When To Apply DFR? • DFR should be conducted throughout the entire PD cycle. • DFR should be initiated EARLY to: • Gain the maximum benefit from the entire process. • Define intended functions, requirements, and noises to support the cascade process.
DFR and the System V Phase I Phase III Phase I Phase III Define Define Total System Total System Customer/System Requirements Customer System Requirements Confirmation Confirmation Integrate and Integrate and Verify Designs Verify Designs Cascade and Cascade and Balance Targets Balance Targets ROBUST ROBUST DESIGNS DESIGNS Phase II Phase II
Principles of DFR DFR IS ABOUT... • Engineering in ideal function and avoiding failure modes. • Measuring technical performance with objective measures. • Anticipating the effects of “noise factors” up-front in the design & planning process. • Developing a “Noise Factor Management” Strategy. • Lowest possible cost solutions.
Principles of DFR DFR IS NOT ABOUT... • Measuring & predicting symptoms of poor quality (e.g. TGW, repair cost per unit ($CPU), R/1000). • Vehicle Evaluation Ratings (VER). • Ignoring “noise factors” until their effects are highlighted in the DVP or worse, with the customer. • Just running orthogonal array experiments (The “Let’s do a DOE/Taguchi” mentality). • Adding to design cost.
Principles of DFR • Conceptual Blockbusting • Typical Thinking Errors • A Guide to Better Thinking • Traditional Philosophy of Quality • Meet the Target • Quality Loss Function Philosophy • Illustrations of DFR Benefits
Conceptual Blockbusting Typical Thinking Errors • Partialism • Time Scale • Polarization
Conceptual BlockbustingTypical Thinking Error Partialism • Focusing on only a limited aspect of the data and constructing a logical argument to prove a particular point of view. • Politicians are expert at this, particularly when they use one economic indicator at the expense of others • Component optimization which leads to system sub-optimization
Conceptual BlockbustingTypical Thinking Error Time Scale • Looking only at the short term implications without considering a longer time scale
Conceptual BlockbustingTypical Thinking Error Polarization • Oversimplifying the choices by considering everything as black or white • If you can’t control a particular factor then you can’t control any factors. Or, if you compromise on one factor you’ll have to compromise on all factors • Sometime the best solution is a shade of gray. Be careful of being forced into an “either/or” decision.
Conceptual Blockbusting A Guide to Better Thinking • Identify your current paradigm(Avoid jumping ahead based on what you think you know) • Avoid closure(Prevent premature closure) • Change your thinking • Differentiate
Conceptual BlockbustingA Guide to Better Thinking Change your thinking by: • Moving your entry point. • Reversing your usual assumptions. • Magnifying, minimizing, substituting or exaggeration. • Changing the context.
Conceptual BlockbustingA Guide to Better Thinking Differentiate • Not every new idea is a good idea • All good ideas need to be logical in hindsight • The skill lies in knowing when to draw a line, and when to push the line! • Determine what’s radical and what’s ridiculous
Target value is ideal Due to manufacturing variation, spec limits are established Tradition thinking : “goal post” mentality Bad assumption: financial costs are only incurred when scrap is made or if an out-of-spec product reaches the customer Good No Good No Good Loss No Loss Loss y Response USL LSL Target Value Traditional Philosophy of Quality
The farther away from the target value, the lower the quality and the less satisfied the customer. The goal is to meet the target, not the specification limits. Meet the Target MEET THE TARGET USL LSL Target Value
As performance varies from target, financial losses due to customer dissatisfaction increases. Total loss may include costs related to assembly difficulty, degraded performance, customer dissatisfaction, warranty cost, etc. The closer to the target value, the more reliable the product will be. Quality Loss Function Philosophy Poor Poor Fair Fair Loss ($) Good Good Best y Response Target Value
If this distribution were produced, the producer and the customer would experience some loss Quality Loss Function Philosophy LSL USL Target Value
Producing this distribution, which has less variance from target, the loss would be lower. This represents a nominal-is-best loss function. Other loss functions include smaller-is-better and larger-is-better. Quality Loss Function Philosophy LSL USL Target Value
Principles of DFRIllustration of DFR Benefits To appreciate the fundamental concept that robust design is trying to accomplish, consider the following simple illustration: • Let x be a control factor • Let n be a noise factor
Principles of DFRIllustration of DFR Benefits • The relationship between these factors and the response z (product performance) is: z = f(n,x) • Variability due to the uncontrollable noise factor n generates variability in product performance z. • Assume that as the product performance deviates from the target (T), the loss is represented by a quadratic function: L(z) = k (z - T)2 = k (f(n,x) – T)2 where k is the quality loss coefficient.
Assuming a target (T=0) and that z follows a standard normal distribution, the effect of the control factor setting on the loss function is illustrated. By selecting a proper setting of control factor x, the loss function with respect to the noise factor can be "flattened." The effect of noise is minimized by a flatter loss function. In the illustration, x = 1 has a flatter loss function than that of x = 2. Principles of DFRIllustration of DFR Benefits z Performance Distribution Performance, z
In terms of product performance z, the effect of choosing the proper setting of control factor x results in different robustness levels of z. The performance variability when x = 1 is less than the performance variability when x = 2. That is, the design is more robust when x = 1 than when x = 2. Principles of DFRIllustration of DFR Benefits
In terms of product performance, robustness can be measured by: Expected loss E[L(z)] Deviation from performance target, mz - T, and performance variability sz A combined measure of the performance mean and standard deviation is called the Signal-to-Noise (S/N) Ratio. Principles of DFRIllustration of DFR Benefits
The objective is to find x that minimizes g(x), where g(x) represents a performance loss function. Without considering variability (noise), design point A is a better choice than design point B. However, when the same amount of variability is considered, B is a better choice than A because the performance loss variation of B is much smaller than that of A. Principles of DFRIllustration of DFR Benefits % Performance Loss
Principles of DFRIllustration of DFR Benefits Stress and Strength Interference • The region of interference between stress and strength defines the probability of failure. This is the region of interest in robustness analysis. • Same (or larger) design margin may have larger probability of failure depending upon the variabilities of the loading and strength. Design Margin Stress Strength Design Margin Stress Strength
Robustness Implementation • In principle, robustness should focus on the intended function rather than error states. The reasoning is that improving the intended function will reduce the error states. • However,eliminating an error state does not guarantee improvement of the intended function, because the elimination of one error state may create other error states.
Robustness Implementation • In any given problem, there is not a single robust solution, but a family of solutions that depend on both subjective and objective assessment • Shift from measuring the symptoms of poor quality to measuring the transformation of energy [Dr. Genichi Taguchi] • This is facilitated using a tool called the Parameter(P)-diagram
Parameter(P)-Diagram Parameters which influence system variability, but are difficult, expensive or impossible to control Noise Factors System Function Output Response Input Signal Error States Control Factors Parameters whose nominal values can be adjusted by the engineer, ideally with minimal impact on cost