Download
1 / 72
720 likes | 1.04k Views
Demographic and Health Profile Maverick County, 2000. Office of Border Health Texas Department of State Health Services. Maverick County. Maverick County, 2000. In population, Maverick County ranked 6 th (out of 32 counties) in the Border region and 60 th (out of 254 counties) in Texas

E N D
Demographic and Health ProfileMaverick County, 2000 Office of Border Health Texas Department of State Health Services
Maverick County, 2000 • In population, Maverick County ranked 6th (out of 32 counties) in the Border region and 60th (out of 254 counties) in Texas • There were 47,297 inhabitants in Maverick County, compared to 2,125,464 in the Border region, and 20,851,820 in Texas • Approximately two percent (2.2%) of the Border region population lived in Maverick County • The area in square miles was 1,280.1 • The number of people per one square mile was 36.9 Source: TDH, Texas Health Facts 2000
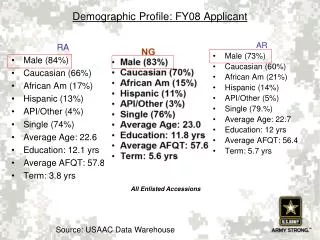
Age and Ethnicity, 2000 In Maverick County, the composition of the population by age was similar to those of the Border region & Texas. The main difference was that Maverick County had a higher percentage of (younger) people between the ages of 0 thru 14 years of age and a lower percentage of people age 15 and older. Maverick County had a higher proportion of Hispanics (95.0%) than that of the Border Region (83.7%), and more than three times that of Texas (32.0%).
Age and Ethnicity 2000 Note: Total percents may not add to 100 due to rounding Source: TDH, Texas Health Facts 2000
Population by Age 2000 Note: Total percents may not add to 100 due to rounding Source: TDH, Texas Health Facts 2000
Population by Ethnicity2000 Note: Total percents may not add to 100 due to rounding Source: TDH, Texas Health Facts 2000
Population by Gender 2000 Source: TDH, Texas Health Facts 2000
Socio-Economics 2000 Source: TDH, Texas Health Facts 2000
Natality In 2000, the natality data of Maverick County compared to the Border region and to the state, revealed the following: • There were 996 babies born in Maverick County. The percentage of teen adolescent mothers was 7.0% which is similar to that of the border region at 6.8%, but higher than that of the state at 5.7% • The percentage of pregnant women in Maverick County that received late or no prenatal care (22.7%) was similar to that of Texas (21.2%), but lower than the Border region (34.3%) • The fertility rate in Maverick County (96.3) was higher than that of Texas (76.6), but lower than the Border region (105.1) * • The percentage of children in Maverick County (6.6%) that were born with low birth weight was similar to those of the Border region (6.7%) and lower than that of Texas (7.4%) • Fertility rates are per 1,000 women ages 15-44 • Source: TDH, Texas Health Facts 2000
Natality 2000 Source: Texas Health Facts 2000
Natality 2000 Source: TDH, Texas Health Facts 2000
Mortality In 2000, the mortality data of Maverick County compared to the rest of the border region and to the state revealed the following: • The mortality rate from Cardiovascular Disease in Maverick County was significantly higher at 305.9 than that of the Border Region (273.3) but lower than that of the state (351.3)* • Cardiovascular Disease accounted for 35.4% of all deaths • Cancer accounted for 20.9% of all deaths • Chronic Lower Respiratory Disease accounted for 2.7% of all deaths • Diabetes accounted for 7.2% of all deaths * Rates are per 100,000 population and adjusted for age Source: TDH, Texas Health Facts 2000
Mortality2000 * Rate is per 100,000 population -- Number too small to calculate meaningful rate Source: TDH, Texas Health Facts 2000
Causes of Death2000 Source: TDH, Texas Health Facts 2000
Morbidity2000 * Rate is per 100,000 population-- Number too small to calculate meaningful rate Source: TDH, Texas Health Facts 2000
Morbidity2000 Source: TDH, BRFSS 2000
Healthy Border / Frontera Saludable Healthy Border 2010 aims to improve health in the United States-Mexico border region, an area defined as 100 kilometers (62 miles) north and south of the United States-Mexico border and close to 2000 miles in length. The Healthy Border 2010 program was established by the U.S.-Mexico Border Health Commission as its binational agenda of health promotion and disease prevention. The Healthy Border 2010 agenda establishes 10-year objectives for binational health promotion and disease prevention in the border region. The program also serves as a basis for the development of bilateral, border-wide and community health improvement plans.
Healthy Border / Frontera Saludable Objectives • Reduce by 25 percent the proportion of persons lacking access to a primary care provider in underserved areas. • 2. Reduce breast cancer death rate for women by 20 percent. • 3. Reduce cervical cancer death rate for women by 30 percent. • 4a. Reduce diabetes death rate by 10 percent. • 4b. Reduce diabetes hospital admissions by 25 percent. • Reduce to zero the population residing in counties exceeding EPA air quality standards.
Healthy Border / Frontera Saludable Objectives • Reduce to zero the proportion of households not connected to either compliant public sewage systems or septic tanks. • 7. Reduce by 25 percent the number of persons hospitalized for acute pesticide poisoning. • 8. Reduce the incidence of diagnosed HIV infection cases among adolescents and adults by 50 percent. • 9a. Reduce the incidence of hepatitis A by 50 percent. • 9b. Reduce the incidence of hepatitis B by 50 percent. • 10. Reduce the incidence of tuberculosis cases by 50 percent.
Healthy Border / Frontera Saludable Objectives 11. Achieve and maintain immunization coverage rate of 90 percent for children 19-35 months. 12. Reduce the motor vehicle crash death rate by 25 percent. 13. Reduce the childhood (under 5 years of age) death rate due to unintentional injuries by 30 percent. 14. Reduce the infant mortality rate by 15 percent. 15. Reduce the infant mortality rate due to birth defects by 30 percent.
Healthy Border / Frontera Saludable Objectives • Increase the proportion of women receiving prenatal care in the first trimester to 85 percent. • Reduce the pregnancy rate among 15 to 17 year old women by 33 percent. • Reduce the suicide death rate by 15 percent. • Reduce the proportion of adults who are obese by 15 percent. • Increase to at least 75 percent the proportion of the population served by community water systems with optimally fluoridated water.
Healthy Border / Frontera Saludable Objectives • Increase to at least 75 percent the proportion of children and adults who use the oral health care system each year. • 22. Reduce the asthma hospitalization rate by 40 percent. • 23. Reduce the rate of alcohol-related motor vehicle crash deaths by 50 percent. • 24. Increase to 89 percent the proportions of adolescents not using alcohol or any illicit drug during the past 30 days. • 25. Reduce by 33 percent the proportion of adults and adolescents currently using tobacco.
Access to Care • Reduce by 25 percent the proportion of persons lacking access to a primary care provider in underserved areas. Access to quality health care is essential to improving the health of the Texas-Mexico border residents. Access to care is required for individuals to obtain preventive health services such as immunizations, regular Pap tests, or early prenatal care. Effective primary care can also educate people about the modifiable risk factors such as smoking. Residents with chronic diseases require health care access for effective management of conditions such as diabetes and hypertension.
In 2000, “Access to Care” data in Maverick County revealed the following: • 35.3% (less than age 65) had no health insurance. The percentage for the border was 32.0% and for the state of Texas the figure was lower at 22.6%.** • 22% of the population was unable to see a doctor due to cost. This was higher than Texas at 15%.* • 27.7% of the women and 15.7% of the men could not see a doctor due to cost.* • The ratio of the population to physician in Maverick County was 1,278:1, in the Border it was 997:1, and in Texas it was 656:1.** Source: * TDH, BRFSS 2000 ** TDH, Texas Health Facts 2000
Access to Care 2000 Source: TDH, Texas Health Facts 2000
Ratio of Population to Healthcare Provider, 2000 Source: TDH, Texas Health Facts 2000
Access to Care 2000 Source: TDH, Texas Health Facts 2000
Cancer • Reduce breast cancer death rate for women by 20 percent. • Reduce cervical cancer death rate for women by 30 percent.
Cancer • Smoking cessation • Eating more fruits and vegetables • More physical activity • Weight control Several types of cancer can be prevented by changes in behaviors or dietary habits. As many as 50 percent of all cancers could be prevented by:
Cancer Equally vital in the fight against cancer is screening for early detection and treatment. In the Texas-Mexico border region, both breast cancer and cervical cancer are often diagnosed at later stages of development. Detection can be improved through mammograms and breast self-examinations for breast cancer, and through Pap smears for cervical cancer. Enhancing the access of border residents to routine health care services is a key element in reducing cancer mortality.
Cancer Prevention and early detection of cancer require various types of resources. First is the need to provide culturally and linguistically appropriate information on prevention, early detection, and treatment to the public and to health care professionals. Second, the public must have access to preventive and diagnostic services as well as treatment.
Cancer In 2000 “Breast & Cervical Cancer” data in Maverick County revealed the following: • In Maverick County, 46% of women ages 18 and above have never had mammogram, compared to 40% of the women the same age in Texas.* • There were 2 new cases of female breast cancer in Maverick County. The breast cancer death rate in the border for the same year was 23.9 and in Texas it was 25.3. ** • In Texas there were 13,928 mammograms performed; of these, 212 were performed in Maverick County.** Source: * TDH, BRFSS 2000 ** TDH, Texas Health Facts 2000
Diabetes 4a. Reduce diabetes death rate by 10 percent. 4b. Reduce diabetes hospital admissions by 25 percent. The growing prevalence of diabetes is a result of a number of trends, including improper nutrition, obesity, and aging of population groups with a predisposition to develop diabetes. Despite the growing number of diabetes cases identified annually, it is believed that a large proportion of persons with diabetes remains undiagnosed.
Diabetes Improving nutrition and increasing physical activity (thereby reducing the prevalence of overweight and obesity) has been shown to reduce the number of persons who develop Type 2 diabetes.
Diabetes In 2000, “Diabetes” data in Maverick County revealed the following: • 25% of people were told that they had high blood pressure, which was similar to the 24% in Texas • 29% were told that they had high cholesterol, which was similar to the 30% in Texas • 13% were told that they had diabetes, which was higher than the 8% in the Border and double that of Texas (6%). Source: TDH, BRFSS 2000
Environmental Health • Reduce to zero the population residing in counties exceeding EPA air quality standards. • Reduce to zero the proportion of households not connected to either compliant public sewage systems or septic tanks. • Reduce by 25 percent the number of persons hospitalized for acute pesticide poisoning.
Environmental Health Human exposures to hazardous agents in the air, water, soil and food, and physical hazards in the environment are major contributions to illness, disability and death worldwide. Pollutants and contaminants that arise on one side of the border can easily affect the air, water, and soil of the other side, as well as affect the health of persons living along the opposite border. In 2000, no air quality data was available for Maverick County.
HIV / AIDS • Reduce the incidence of diagnosed HIV infection cases among adolescents and adults by 50 percent. HIV/AIDS is no longer restricted to specific population groups: HIV infection and AIDS have been reported in almost every age and socio-economic group, and in all large cities in the Texas-Mexico border. As with all other communicable diseases, HIV/AIDS transmission is not restrained by political boundaries.
HIV / AIDS HIV/AIDS prevention requires a broad range of medical and counseling services, accompanied by information, education and other activities. Many strategies have been developed to reduce the spread of HIV/AIDS, including the promotion of safer sex practices and the reduction of needle sharing. In addition, counseling, education and information should be appropriate for local cultures and languages.
HIV / AIDS An important issue, however, is access to care, as knowledge of HIV/AIDS status is a key part of halting the transmission of HIV. One of the major barriers to care is the lack of trained providers on both sides of the border.
HIV • The HIV incidence rate reported in Maverick County (8.5) was lower than the rate in the Border (10.2) and Texas (9.2) In 2000, “HIV” data for Maverick County revealed the following: Source: TDH, Texas Health Facts 2000
Immunizations and Infectious Diseases 9a. Reduce the incidence of hepatitis A by 50 percent. 9b. Reduce the incidence of hepatitis B by 50 percent. • Reduce the incidence of tuberculosis cases by 50 percent. • Achieve and maintain immunization coverage rate of 90 percent for children 19-35 months.
Immunizations and Infectious Diseases Increased vaccination coverage has produced dramatic declines in the incidence of some infectious diseases. For example, measles and mumps cases have decreased significantly in the past decade. The strategy is to detect, control and prevent infectious diseases, and then to maximize the vaccination coverage rate in the at risk population.
Immunizations and Infectious Diseases For diseases that are not preventable or only partially preventable by vaccine, a different approach is required. Reducing tuberculosis rates requires active surveillance, including testing of at-risk populations, providing curative therapy to tuberculosis patients, ensuring that therapy is completed and investigating close contacts of tuberculosis patients. Lack of access to care can delay the detection of tuberculosis cases, and limit direct observation of therapy by health care providers.
Immunizations and Infectious Diseases In 2000, “Immunizations and Infectious Diseases” data for Maverick County revealed the following: • 81% of people age 65 and older did not get a flu shot which was much higher than the 59% for the same age group in Texas * • 77% of people in aged 65 and older had never had a pneumonia vaccine, compared to 44% for the same age group n Texas * • The Hepatitis A rate was 8.5, higher than the rate for the Border (7.5) but lower than Texas (9.3) ** • The Tuberculosis rate was 10.6, which was lower than the rate for the Border (12.3) but higher than that of Texas (7.2) ** Source: * TDH, BRFSS 2000 ** TDH, Texas Health Facts 2000
Injury and Violence Prevention • Reduce the motor vehicle crash death rate by 25 percent. • Reduce the childhood (under 5 years of age) death rate due to unintentional injuries by 30 percent.
Injury and Violence Prevention The risk of death due to a motor vehicle crash is greatest among adolescents and young adults (15 to 24 years of age) and the elderly population (75 or more years of age). Motor vehicle deaths can be prevented by increasing the use of automobile seat belts, reducing the consumption of alcohol by automobile drivers, enhancing the enforcement of traffic laws (particularly maximum speed limits), and improving the quality of roads, lighting and other safety enhancements.
Injury and Violence Prevention Unintentional injuries are an important cause of death among young children, but particularly so for those 1 to 4 years of age. Important causes of injury deaths include motor vehicle crashes, drowning, poisonings, and fires. Important preventive measures would be restricting unsupervised access to swimming pools or other bodies of water, and improved safeguards against access to household toxic substances by young children.