Download
1 / 26
260 likes | 273 Views
VISUALIZATION AND ANALYSIS OF STUDENT ACTIVITY ON MOODLE CONTENT MANAGEMENT SYSTEM. Cristian-Győző Haba , Liviu Breniuc Faculty of Electrical Engineering “Gheorghe Asachi ” Technical University of Iasi. Introduction.

E N D
VISUALIZATION AND ANALYSIS OF STUDENT ACTIVITY ON MOODLE CONTENT MANAGEMENT SYSTEM Cristian-GyőzőHaba, LiviuBreniuc Faculty of Electrical Engineering “Gheorghe Asachi” Technical University of Iasi 6th International Conference on Education and New Learning Technologies Barcelona - 7th - 9th of July 2014
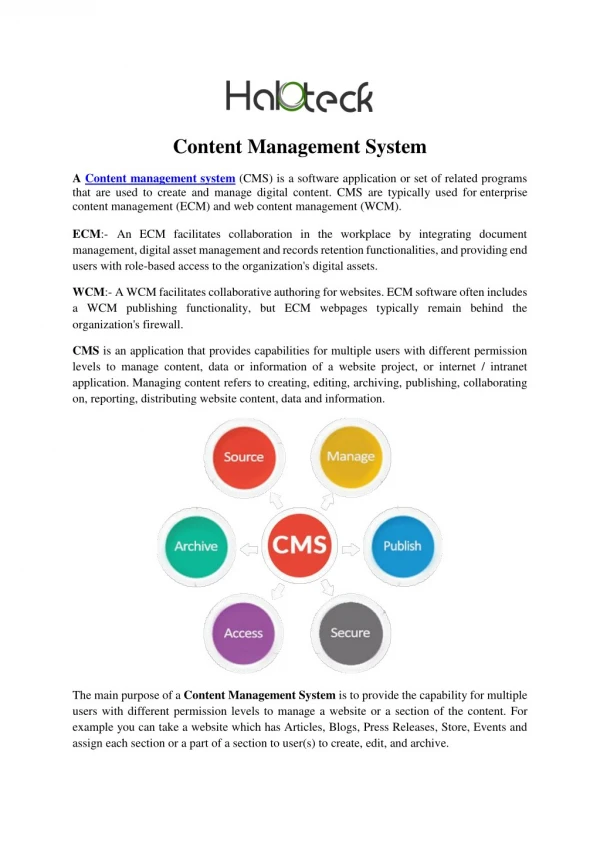
Introduction • CMS systems have become common tools used by teachers to manage the educational content, interaction with students in virtual space and for monitoring their activity related to courses. • These systems are extensively used to create the teaching material in electronic format, to manage this content and also to evaluate the activity of students based on logs generated for every interaction the user has with the CMS. • These CMS systems can support a wide range of teaching styles from the simple content management and the simples teaching methodology to more elaborate ones that involve latest teaching theories and technologies. 6th International Conference on Education and New Learning Technologies Barcelona - 7th - 9th of July 2014
Moodle use at TU Iasi • Choice to use Moodle was influenced by the following facts: • it is open source: it is free and also the source code is available => can be modified to add new functionalities; • it is widely used for e-learning purposes; • it has a large set of modules that implement all kind of e-learning activities; • the available modules are increasing in number constantly as the development community of the system, which is open source, is very active. 6th International Conference on Education and New Learning Technologies Barcelona - 7th - 9th of July 2014
Moodle use at TU Iasi (2) • Adoption of Moodle system was done independently in several departments of our faculty. • Other CMS systems have also been adopted as a result of the implementation of some EU programs. • Expanding the use of Moodle system occurred with the implementation of the Didatec project in the frame of POS-DRU program (operational development program for development of human resources). 6th International Conference on Education and New Learning Technologies Barcelona - 7th - 9th of July 2014
Moodle use at TU Iasi (3) • One of the DidaTec project goals was education of more than 800 teachers from 10 Romanian universities (including TU Iasi) to develop electronic teaching materials in the area of engineering. • The project didn't impose a certain CMS system allowing implementing universities to choose the system of choice based on previous experience and familiarity with the platform. • TU Iasi has opted for Moodle which was used for the elaboration of teaching materials for more than 70 courses. 6th International Conference on Education and New Learning Technologies Barcelona - 7th - 9th of July 2014
Educational content types • Educational content types created and used within Moodle • lecture notes • laboratory reports • seminars with solved and suggested problems • project guides and project examples • tutorials in text format but also animated tutorials. 6th International Conference on Education and New Learning Technologies Barcelona - 7th - 9th of July 2014
Activities on Moodle platform • Student activities on Moodle platform: • accessing course materials • accessing and posting on discussion forums • preparation and uploading of home works • test preparation and participation in quizzes; • exchanging messages with teachers or peers; • using and contributing to glossaries of terms. 6th International Conference on Education and New Learning Technologies Barcelona - 7th - 9th of July 2014
Courses managed by Moodle in Electrical Engineering Department
Activity management in Moodle • One of the important features of CMS systems is their ability to record user activity and generate reports on this activity. • In the Moodle system reports can be configured to: • include activities of one or all students, • include a specific day or all days since the course was started, • select a specific activity or all the activities, • select a specific action type or all types. 6th International Conference on Education and New Learning Technologies Barcelona - 7th - 9th of July 2014
Configuring content of activity reports • Moodle forms for activity report configuration 6th International Conference on Education and New Learning Technologies Barcelona - 7th - 9th of July 2014
Activity reports • Display of teacher (left) and student (right) activity reports 6th International Conference on Education and New Learning Technologies Barcelona - 7th - 9th of July 2014
Activity visualization • We are interested in visualizing data in the following ways: • graphs that represent relations between users (student or teachers) • graphs related to activities (opening a course support document, opening a laboratory work document, posting a homework, posting a message on student forum). User nodes issuing high number of edges, easily identifiable by visual inspection of the graph correspond to a high activity of that user; 6th International Conference on Education and New Learning Technologies Barcelona - 7th - 9th of July 2014
Activity visualization • We are alsointerested in visualizing data in the following ways: • pie charts representing percentages of student activities based on types. • graphs that represent time relations between events related to student activities that can be use to extract information such as: • who are the first 5 students that replied after the homework was launched; • how many of the posted messages in the first 24 hours after an activity was launched is related to that event and so on. 6th International Conference on Education and New Learning Technologies Barcelona - 7th - 9th of July 2014
Graphviz • One popular visualization software is Graphviz developed at the AT&T Labs Research which allows drawing graphs using a script written in dot language. • Graphviz consists of several drawing tools that allow the same dot script to be layout in different ways. • dot and neato tools can be used to draw directed graphs • twopi and circo tools are used to draw directed graphs with radial and circular layout respectively. 6th International Conference on Education and New Learning Technologies Barcelona - 7th - 9th of July 2014
Activityvisualization • The base elements of the directed graphs are nodes and edges. Both nodes and edges can be labeled and have a list of attributes that can be set in the script. • In order to visualize the activity of students we can build associated directed graphs based on the following correspondence: • nodes correspond to registered users and their actions in the Moodle system. • edges correspond to activities. 6th International Conference on Education and New Learning Technologies Barcelona - 7th - 9th of July 2014
Actions performed in Moodle system 6th International Conference on Education and New Learning Technologies Barcelona - 7th - 9th of July 2014
Directed graph of student activity layout using circo • graph with many edges between user nodes and actions which will be of no use to appreciate the any student's activity 6th International Conference on Education and New Learning Technologies Barcelona - 7th - 9th of July 2014
Enhancing student activity visualization • colored arrows – edge color matchesthenumber of similar edges 6th International Conference on Education and New Learning Technologies Barcelona - 7th - 9th of July 2014
Enhancing student activity visualization • arrow head size – arrowsizematchesthenumber of similar edges 6th International Conference on Education and New Learning Technologies Barcelona - 7th - 9th of July 2014
Enhancing student activity visualization • node size – node radius matchesthenumber of similar edgesstartingfromnode 6th International Conference on Education and New Learning Technologies Barcelona - 7th - 9th of July 2014
Enhancing student activity visualization • arrow color and head size and node size – combination of previousthree 6th International Conference on Education and New Learning Technologies Barcelona - 7th - 9th of July 2014
Student activity displayed using Graphviz integrated in Moodle platform • Report isgenerated in tabular andgraphical format • Renderingengine (dot,neato,twopi or circo) canbeselected 6th International Conference on Education and New Learning Technologies Barcelona - 7th - 9th of July 2014
Implementedassociations • Different association schemes were implemented in ordertohelpteachers evaluate student activity: • Normal association: more activitycorrespondstolargersize of graphicalelements (arrowsize, nodesize, color) • Reverse sizeassociation: lessactivitycorrespondstolargersize of graphicalelements • Thresholdassociation: graphical element matchesthesize of graphical element onlyifactivity (number of edges) is over a selectedthresholdvalue 6th International Conference on Education and New Learning Technologies Barcelona - 7th - 9th of July 2014
Implementedassociations (2) • Reverse size association: this type of visualization is useful when teachers what to find the students who were the less actives for a course or some activity. • Thresholdassociation: it is common for teachers to impose a threshold for the evaluation of some activity meaning that if some student's activity falls below the threshold it is no longer taken into consideration. • If in normal association the size of graph elements is computed based on student activity and every log contributes to that size, in threshold based association the size is computed only for the activities that add logs that are above the threshold set by the teacher. 6th International Conference on Education and New Learning Technologies Barcelona - 7th - 9th of July 2014
Conclusions • In actual version of the system, reports are displayed only in tabular format and if one wants a graphical representation she must save the reports in a file to be used with other available software. • Graphical visualization of student activity can help in the initial assessment of student involvement in teaching activities managed by the CMS, allows a rapid comparison between students or involvement of the same student in two different courses or activities. • Future work will seek the extension of visualization modes by integrating into the platform of other public available visualization software. Work will be done to encapsulate these reporting methods into a distinct module that could be installed and configured separately from the other Moodle modules 6th International Conference on Education and New Learning Technologies Barcelona - 7th - 9th of July 2014
Invitation • 2014 International Conference on Electricaland Power Engineering, October 16-18, 2014 • Iasi, Romania • IEEE technicalsponsoredconference • http://www.epe.tuiasi.ro/2014