Download

1 / 23
240 likes | 374 Views
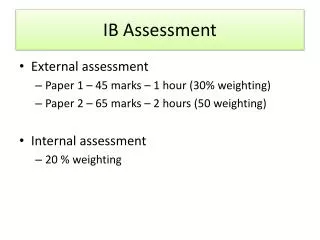
IB Internal Assessment Design. Designing an Experiment. Formulate a research question. Read the background theory. Decide on the equipment you will need. Design a method. Decide what safety and environmental considerations there are. IB Design Criteria. Research Question.

E N D
Designing an Experiment • Formulate a research question. • Read the background theory. • Decide on the equipment you will need. • Design a method. • Decide what safety and environmental considerations there are.
Research Question • This is the purpose of your experiment. • Concisely state what you are trying to find out. • It is good practice to write a hypothesis too.
Background Theory • A literacy search is usually carried out to find out what work has been done that is similar to your research question. • This may give methods that have been used previously and will provide the ”science” behind the experiment (this backs up your hypothesis). • Remember to add full references in footnotes.
Equipment List • List the equipment you intend to use, include the size (e.g. 25ml measuring cylinder). • It is good practice to state the uncertainty of your measuring equipment (e.g. ± 1ml). • Include chemicals in your list, their concentration and volumes / masses to be used.
Method • State your variables, and how you will measure / control them: • Independent variable. • Dependent variable. • Control variables.
Method • Write out your intended procedure (like a recipe). • Be sure to plan to take enough repeats to make your experiment reliable. • Be sure to plan to collect relevant measurements.
Safety and Environmental Considerations • Assess the risks and write down any precautions necessary. • Write down any environmental issues that may arise from your experiement. • Remember the basic lab rules (no need to write these down).
Recording raw data • Record all data in a suitable table. • Check table headers are clear, containing units and uncertainties. • Give the table a number and a full title. • Record your qualitative data.
Processing raw data • This may include some of the following: • Calculation of averages • Calculation of standard deviation • Other statistical analysis • Production of a graph with a line of best fit. • Production of a summary table.
Presenting processed data • This means you present the data using the most appropriate graph(s). • Graphs have correct title and labels. • Graph labels include units and uncertainties. • Error bars may be included.
Concluding • Give a detailed description of your results, referring to your data and graphs. • Explain your results with reference to cited sources (in a footnote).
Evaluating procedures • Describe the factors that were weaknesses or limited the accuracy or scope of your investigation (try NOT to look incompetent). • An evaluation describes how the mentioned weaknesses may have effected the results you recorded.
Improving the investigation • Improvements need to be detailed and should relate to the weaknesses previously identified. • Always suggest an increase in sample size (reliability). • Always suggest an increase in the range of your independent variable (trends).
Present a professional document • Title page containing your information. • Set up your document with appropriate headers and footers. • Contents page, with page numbers. • Break your document up into numbered sub-sections
Present a professional document • Tables with titles (Table 1. Title….) • Graphs with titles (Figure 1. Title….) • References: List your sources (from your footnotes) in alphabetical order, by author’s surname, use the Oxford referencing system.