Download
1 / 44
440 likes | 552 Views
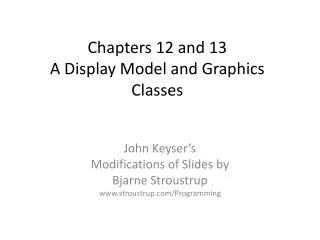
Chapter 12 A display model. Bjarne Stroustrup www.stroustrup.com/Programming. Overview. Why graphics? A graphics model Examples. Why bother with graphics and GUI?. It’s very common If you write conventional PC applications, you’ll have to do it It’s useful Instant feedback

E N D
Chapter 12A display model Bjarne Stroustrup www.stroustrup.com/Programming
Overview • Why graphics? • A graphics model • Examples Stroustrup/Programming
Why bother with graphics and GUI? • It’s very common • If you write conventional PC applications, you’ll have to do it • It’s useful • Instant feedback • Graphing functions • Displaying results • It can illustrate some generally useful concepts and techniques Stroustrup/Programming
Why bother with graphics and GUI? • It can only be done well using some pretty neat language features • Lots of good (small) code examples • It can be non-trivial to “get” the key concepts • So it’s worth teaching • If we don’t show how it’s done, you might think it was “magic” • Graphics is fun! Stroustrup/Programming
Why Graphics/GUI? • WYSIWYG • What you see (in your code) is what you get (on your screen) • direct correspondence between concepts, code, and output Stroustrup/Programming
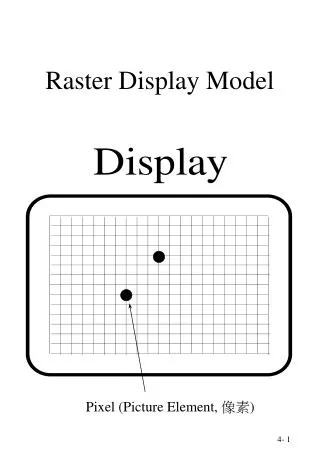
Display model Shape Display Engine attach() • Objects (such as graphs) are “attached to” a window. • The “display engine” invokes display commands (such as “draw line from x to y”) for the objects in a window • Objects such as Square contain vectors of lines, text, etc. for the window to draw draw() “window” Square attach() Stroustrup/Programming
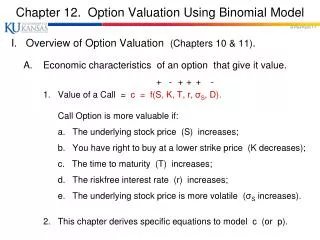
Display model • An example illustrating the display model intmain() { using namespace Graph_lib; // use our graphics interface library Point tl(100,200); // a point (obviously) Simple_window win(tl,600,400,"Canvas"); // make a simple window Polygon poly; // make a shape (a polygon, obviously) poly.add(Point(300,200)); // add three points poly.add(Point(350,100)); poly.add(Point(400,200)); poly.set_color(Color::red); // make the polygon red (obviously) win.attach(poly); // connect polyto the window wait_for_button(); // give control to the display engine } Stroustrup/Programming
The resulting screen Stroustrup/Programming
Graphics/GUI libraries • You’ll be using a few interface classes we wrote • Interfacing to a popular GUI toolkit • GUI == Graphical User Interface • FLTK: www.fltk.org // Fast Light Tool Kit • Installation, etc. • see Appendix D and ask instructor/friend • FLTK • Our GUI and graphics classes • Project settings • This model is far simpler than common toolkit interfaces • The FLTK (very terse) documentation is 370 pages • Our interface library is <20 classes and <500 lines of code • You can write a lot of code with these classes • And what you can build on them Stroustrup/Programming
Graphics/GUI libraries (cont.) • The code is portable • Windows, Unix, Mac, etc. • This model extends to most common graphics and GUI uses • The general ideas can be used with any popular GUI toolkit • Once you understand the graphics classes you can easily learn any GUI/graphics library • Well, relatively easily – these libraries are huge Stroustrup/Programming
Graphics/GUI libraries Our code Our interface library A graphics/GUI library (here FLTK) The operating system (e.g. Windows or Linux) Our screen • Often called “a layered architecture” Stroustrup/Programming
Coordinates 0,0 200,0 • Oddly, y-coordinates “grow downwards” // right, down • Coordinates identify pixels in the window on the screen • You can re-size a window (changing x_max() and y_max()) 50,50 200,100 0,100 Stroustrup/Programming
Interface classes Line_style Window Color • An arrow means “is a kind of” • Color, Style, and Point are “utility classes” used by the other classes • Window is our interface to the GUI library (which is our interface to the screen) Shape Point Simple_window Line Lines Polygon Rectangle Text … Stroustrup/Programming
Interface classes • Current • Color, Line_style, Font, Point, • Window, Simple_window • Shape, Text, Polygon, Line, Lines, Rectangle, … • Axis • Easy to add (for some definition of “easy”) • Grid, Block_chart, Pie_chart, etc. • Later, GUI • Button, In_box, Out_box, … Stroustrup/Programming
Demo code 1 // Getting access to the graphics system (don’t forget to install): #include "simple_window.h" // stuff to deal with your system’s windows #include "Graph.h" // graphical shapes using namespace Graph_lib; // make names available // in main(): Simple_window win(Point(100,100),600,400,"Canvas"); // screen coordinate (100,100) top left of window // window size(600*400) // title: Canvas wait_for_button(); // Display! Stroustrup/Programming
A “blank canvas” Stroustrup/Programming
Demo code 2 Axis xa(Axis::x, Point(20,300), 280, 10, "x axis"); // make an Axis //an axis is a kind of Shape // Axis::x means horizontal // starting at (20,300) // 280 pixels long // 10 “notches” // text “x axis win.set_label("Canvas #2"); win.attach(xa); // attach axis xa to the window wait_for_button(); Stroustrup/Programming
Add an X-axis Stroustrup/Programming
Demo code 3 win.set_label("Canvas #3"); Axis ya(Axis::y, Point(20,300), 280, 10, "y axis"); ya.set_color(Color::cyan); // choose a color for the axis ya.label.set_color(Color::dark_red); // choose a color for the text win.attach(ya); wait_for_button(); Stroustrup/Programming
Add a Y-axis (colored) Yes, it’s ugly, but this is a programming course, not a graphics design course Stroustrup/Programming
Demo code 4 win.set_label("Canvas #4"); Function sine(sin,0,100,Point(20,150),1000,50,50); // sine curve //plot sin() in the range [0:100) //with (0,0) in (20,150) //using 1000 points //scale x values *50, scale y values *50 win.attach(sine); wait_for_button(); Stroustrup/Programming
Add a sine curve Stroustrup/Programming
Demo code 5 win.set_label("Canvas #5"); sine.set_color(Color::blue); // I changed my mind about sine’s color Polygon poly; // a polygon, a Polygon is a kind of Shape poly.add(Point(300,200)); // three points makes a triangle poly.add(Point(350,100)); poly.add(Point(400,200)); poly.set_color(Color::red); // change the color poly.set_style(Line_style::dash); // change the line style win.attach(poly); wait_for_button(); Stroustrup/Programming
Add a triangle (and color the curve) Stroustrup/Programming
Demo code 6 win.set_label("Canvas #6"); Rectangle r(Point(200,200), 100, 50); win.attach(r); wait_for_button(); Stroustrup/Programming
Add a rectangle Stroustrup/Programming
Demo code 6.1 • Add a shape that looks like a rectangle closed_polylinepoly_rect; poly_rect.add(Point(100,50)); poly_rect.add(Point(200,50)); poly_rect.add(Point(200,100)); poly_rect.add(Point(100,100)); win.set_label("Canvas #6.1"); Stroustrup/Programming
Add a shape that looks like a rectangle But is it a rectangle? Stroustrup/Programming
Demo code 6.2 • We can add a point poly_rect.add(Point(50,75); // nowpoly_recthas 5 points win.set_label("Canvas #6.2"); • “looking like” is not the same as “is” Stroustrup/Programming
Obviously a polygon Stroustrup/Programming
Add fill r.set_fill_color(Color::yellow); // color the inside of the rectangle poly.set_style(Line_style(Line_style::dash,4)); // make the triangle fat poly_rect.set_fill_color(Color::green); poly_rect.set_style(Line_style(Line_style::dash,2)); win.set_label("Canvas #7"); Stroustrup/Programming
Add fill Stroustrup/Programming
Demo Code 8 Text t(Point(100,100),"Hello, graphical world!"); // add text win.set_label("Canvas #8"); Stroustrup/Programming
Add text Stroustrup/Programming
Demo Code 9 • Modify text font and size t.set_font(Font::times_bold); t.set_font_size(20); Stroustrup/Programming
Text font and size Stroustrup/Programming
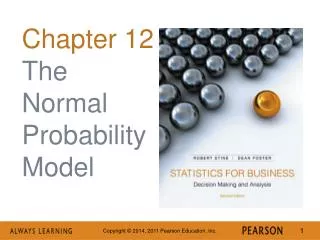
Add an image Image ii(Point(100,50),"image.jpg"); // open an image file win.attach(ii); win.set_label("Canvas #10"); Stroustrup/Programming
Add an image Stroustrup/Programming
Oops! • The image obscures the other shapes • Move it a bit out of the way ii.move(100,200); win.set_label("Canvas #11"); win.wait_for_button(); Stroustrup/Programming
Move the image Note how the parts of a shape that don’t fit in the window is “clipped” away Stroustrup/Programming
Demo Code 12 Circle c(Point(100,200),50); Ellipse e(Point(100,200), 75,25); e.set_color(Color::dark_red); Mark m(Point(100,200),'x'); ostringstreamoss; oss << "screen size: " << x_max() << "*" << y_max() << "; window size: " << win.x_max() << "*" << win.y_max(); Text sizes(Point(100,20),oss.str()); Image cal(Point(225,225),“snow_cpp.gif"); // 320*240 pixel gif cal.set_mask(Point(40,40),200,150); // display center of image win.set_label("Canvas #12"); win.wait_for_button(); Stroustrup/Programming
Add shapes, more text Stroustrup/Programming
Boiler plate #include "Graph.h" // header for graphs #include “Simple_window.h" // header containing window interface int main () try { // the main part of your code } catch(exception& e) { cerr << "exception: " << e.what() << '\n'; return 1; } catch (...) { cerr << "Some exception\n"; return 2; } Stroustrup/Programming
Primitives and algorithms • The demo shows the use of library primitives • Just the primitives • Just the use • Typically what we display is the result of • an algorithm • reading data • Next lectures • 13: Graphics Classes • 14: Graphics Class Design • 15: Graphing Functions and Data • 16: Graphical User Interfaces Stroustrup/Programming