
Probability
Sample Space. Liquid precipitation (event E2). No precipitation (event E1). Frozen precipitation (event E3). Probability. Venn Diagram: The Sample Space consists of three event categories:

Probability
E N D
Presentation Transcript
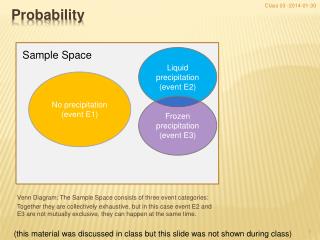
Class 03 -2014-01-30 Sample Space Liquid precipitation (event E2) No precipitation (event E1) Frozen precipitation (event E3) Probability Venn Diagram: The Sample Space consists of three event categories: Together they are collectively exhaustive, but in this case event E2 and E3 are not mutually exclusive, they can happen at the same time. (this material was discussed in class but this slide was not shown during class)
Class 03 -2014-01-30 Sample Space No precipitation (event E1) Liquid precipitation (event E2) Compound event: Any of the possible events (E1 OR E2 OR E3) Frozen precipitation (event E3) Probability Another illustration of Probability : The Sample Space consists of three event categories: Together they are collectively exhaustive, but in this case event E2 and E3 are not mutually exclusive, they can happen at the same time. (this material was discussed in class but this slide was not shown during class)
Class 03 -2014-01-30 The probability of any event is nonnegative The probability of the compound event is 1 The probability of one or the other of two mutually exclusive events isthe sum of the individual probabilities. Axioms of Probability (this material was discussed in class but this slide was not shown during class)
Class 03 -2014-01-30 0≤ P(E) ≤ 1 P(S) = 1 P(E1 or E2) = P(E1) +P(E2), but only if E1 and E2 are mutually exclusive events, i.e. P(E1 and E2) = 0 Axioms of Probability (this material was discussed in class but this slide was not shown during class)
Class 03 -2014-01-30 The probability of the complement event: P(Ec) =1 – P(E) Some Probability Algebra (this material was discussed in class but this slide was not shown during class)
Class 03 -2014-01-30 For each month since 1996 temperatures, wind, precipitation, … (Historical data archives are stored In other archives) Albany Airport Weather data Data can be obtained from http://www.erh.noaa.gov/aly/Climate/Albany/ClimateALB.htm
Class 03 -2014-01-30 Example page: Table with December 2013 data This is embedded into HTML web page and it requires extra work to prepare data for statistical analysis. (Notepad, EXCEL) Albany Airport Weather data Data can be obtained from http://www.erh.noaa.gov/aly/Climate/Albany/ClimateALB.htm
Class 03 -2014-01-30 Filename: KALB_201312.csv • We will learn to read data-tables into R • Using parts of the data table by use of column names • Create simple plots • Create a first loop in the program • Use if-else statements for flow control in the program And we will begin with the exploratory data analysis: Frequentist’s approach to probability and applying the arithmetic mean to obtain a monthly mean temperature from daily data samples. Analysis of Daily Weather data Albany Airport - Dec 2013


