Download
1 / 38
380 likes | 468 Views
Gain expertise in error analysis, data reliability, modeling, statistical distributions, and more for effective environmental policy implementation.

E N D
Overview of 355 Themes and Concepts Environmental Problems are generally characterize by noisy and ambiguous data. Understanding errors and data reliability/bias is key to implementing good policy Making a model of the data is an advanced technique that is sorely needed in this field
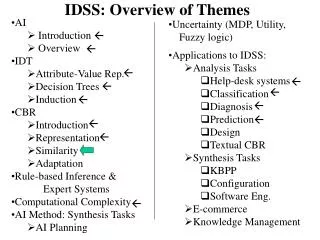
Specific Concepts Review the explicit calculation of χ2; conceptually understand expected frequencies. Know the mapping of units of standard deviation on the probability. Z-test application Know how to use the regression tool in Excel! Know how to compute Poisson statistics Know how to visually inspect a graph or waveform of data. Use of the KS test and why its powerful.
More Concepts Understand uncertainty and confidence limits in terms of predicting the future behavior of some trend. Understand what non-linearity means and how lag times work in non-linear systems (e.g. predator- prey relations). Understand how one can make an estimate. Understand counting errors sqrt(N)/N
Goals of this Course • To gain practice in how to frame a problem • To practice making toy models of various data waveforms • To understand the purpose of making a model • To understand the limitations of modeling and that models differ mostly in the precision of predictions made • Provide you with a mini tool kit for analysis
Sequence for Environmental Data Analysis • Conceptualization of the problem which data is most important to obtain; how to obtain a random/representative data set? • Methods and limitations of data collection know your biases (e.g. Sunshine Moonbeam) • Presentation of Results => data organization, reduction, visualization, statistical analysis • Compare different models using sound statistical tests (cause they always work)
Statistical Distributions • Why are they useful? • How to construct a frequency distribution and/or a histogram of events. • Frequencies are probabilities • How the law of large numbers manifests itself central limit theorem; random walk; expectation values
Statistical Distributions Mapping dispersion units into probabilities of an event occurring
Some Tools • Linear Regression predictive power lies in scatter; the “r” value is unimportant for scientific analysis • Slope errors (cell C18 in Excel) are important and must be factored in to determine the total uncertainty of your prediction • Identify anomalous points by sigma clipping (+/- 2s (1-cycle))
More Tools • Chi square test – measures goodness of fit • Understand how to determine your expected frequencies • Chi square minimization used to find best fitting model • Chi square statistic used to accept or reject the null hypothesis (that the data is consistent with the model plus random fluctuations)
More Tools • Moving average technique applied to noisy data • Z-test: determine significance between two mean values for two distributions
KS Test • Most powerful for comparing two distributions • Statistic is the maximum difference between 2 cumulative frequency distributions • Data does not need to be normally distributed • Best means to compare data distribution against a model • Can’t be used for sample sizes less than 10
Arrival Statistics (Poisson) • Events have to be discrete • A good measure of the average event rate allows the probability that N events will occur over some time period to be determined • Large values of l produces a distribution that is normal.
Green House Effect Long wavelength absorption properties of our atmosphere increase the surface temperature- Water vapor is the dominant effect, followed by CO2
Methane • Potential role of methane is larger than CO2 • GWP = 21 • Scales with population growth • Released from permafrost • Released from hydrate deposits • Emissions now rising again due to global wetlands returning from prolonged drought
Difficulty of Climate Change Detection • Data is noisy • Temporal baseline of data is not long enough • Multi decadal climate cycles seem to be very important • Oceans act as a buffer that delays the overall effect
Predator Prey Relations • Non linear in nature small changes in one part of the system can produce rapid population crashes • Density dependent time lags are important (what causes them?) • “Equilibrium” is intrinsically unstable • Logistic growth curve makes use of carrying capacity concept, K • Negative feedback occurs as you approach K • R selected vs. K selected mammals
P vs H • Understand why graphical representations look like this: • What drives the lag time?
Human Population Projections • What assumptions are used? • Does human population growth respond to the carrying capacity concept? • World population growth rate is in continuous decline (but still positive) will this continue indefinitely? • Oscillatory model may be most realistic • What role does increased life expectancy have?
Estimation Techniques • Extremely useful skill makes you valuable • Devise an estimation plan what factors do you need to estimate • Scale from familiar examples when possible • Perform a reality check on your estimate
Applied Ecology • Know what the terms mean and understand what an iterative solution is:
Applied Ecology II • Understand from the point of view of the framework (e.g. the equations) why stability is very hard to achieve • What role does finite reproductive age play? • What makes human growth special within this framework. • Understand concepts of equilibrium occupancy and demographic potential • Why is error assessment so important here?
Skewed Distributions This is a probability distribution function and one can still use the area under the curve or area between x values to determine probabilities via numerical integration
Time Series Analysis • Much of environmental data analysis or modeling represents the time evolution of some observed quantity. • Long term trends with cyclical oscillations and/or short term regular deviations; plus random variations
Value of time Series Analysis Gas Prices: The long term trend is steep and rises above the fluctuations Climate: The long term trend is overwhelmed by the fluctuations • You want to uncover the long term trend that may be buried under the fluctuations • Determining the amplitude of the fluctuations helps to determine if any recent events are aberrant • Two cases: Gas prices; Climate Cycles:
Multiple Sine Wave Fits • Can often reproduce the behavior seen in complex time series
The Data Rules • Always, always ALWAYS plot your data • Never, never NEVER put data through some blackbox reduction routine without examining the data themselves • The average of some distribution is not very meaningful unless you also know the dispersion. Always calculate the dispersion and then know how to use it! The Average value for this data set is totally meaningless
More Data Rules • Always compute the level of significance when comparing two distributions • Always know your measuring errors. If you don't them you are not doing science. • Always calculate the dispersion in any correlative analysis. Remember that a correlation is only as good as the dispersion of points around the fitted line.
The Biggest Rules • Always require someone to back up their "belief statements" with credible data. • Change the world. Stop being a passive absorber of some one else's belief system. • Frame all environmental problems objectively and seek reliable data to resolve conflicts and make policy
And Now For Something Completely Different: • Current Tag Cloud: Global climate change, species extinction, oil depletion, world food crises, global inequity, environmental justice, depletion of mineral resources, blogs and rants, sustainability, alternative energy solutions, alternative fuels, more blogs, Black Friday, flash mobs, crowd sourcing, NMFP
Your World Upon Graduation • The Fossil Fuel Legacy
Engineering the Planet What Compels us to do so?
Consumption: Pros and Cons • This depends on how you want to index consumption – personal consumption/affluence is different than production/consumption that indirectly leads to better society infrastructure and services. • What matters is the rate of consumption relative to the resource base. Main problem is that short term market growth, which we value, wants high rates. • Sustainability demands lower rates this is the clash of values.
Key Historical Moments • We are special (different than other animals) • We are uniquely positioned at the center of the Universe (reflects our “special-ness”) • The Universe is ordered, logical and rational – Age of Reason humankind is unbounded • The Newtonian world shows us the machine and it is precise (we can now engineer the planet) • The notion of uncertainty, as a valid and integral scientific concept, arises too late in this process we already have truth pathways established
Essence of Science • Knowledge based on measurement means that knowledge is both uncertain and subject to change when new and better measurements are made – there is no room for absolute truth in this methodology • Problems can then only be solved by objective means that rely on real data and not bias or wishful thinking.
Choice Pathways • Which world does humanity want to live in? • One that is based on a belief system that is then projected on to the natural world to support that belief (this is the BIAS) • One where scientific methodology and thinking is used to enable, on a planet wide scale, the enlightenment motto that all men are created equal
Relationship with the Land is key • Three possibilities • The Land is Sacred “Indigienous Model” your ancestors are buried in it • The Land is shared “European Model” lots of people, not much land • The Land is Owned “American Model” lots of land, I can piss on it if I want, afterall, its mine.
Continued Economic Development Requires high Energy Use • 1900 100 Million Capitalists to build markets • 2003 2.5 Billion new capitalists • Energy is the core of the “environmental problem”; Environment is the core of the energy problem • The energy-environment intersection is the core of the sustainable-prosperity problem
Resolution? • We need to stop be driven by market economics and start to recognize that energy and environment is a shared resource. • Your generation needs to more seriously engage with the issue of quantitative reasoning if you are to make informed choices. Otherwise, nothing good happens