Download
1 / 44
500 likes | 769 Views
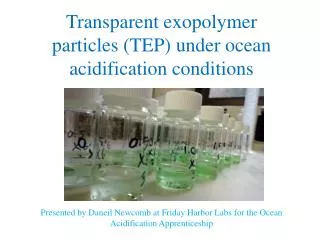
Transparent exopolymer particles (TEP) under ocean acidification conditions. Presented by Daneil Newcomb at Friday Harbor Labs for the Ocean Acidification Apprenticeship. What is TEP?. A carbohydrate rich polysaccharide form of organic matter produced by phytoplankton and some bacteria

E N D
Transparent exopolymer particles (TEP) under ocean acidification conditions Presented by Daneil Newcomb at Friday Harbor Labs for the Ocean Acidification Apprenticeship
What is TEP? • A carbohydrate rich polysaccharide form of organic matter produced by phytoplankton and some bacteria • Most likely produced as a response to cell stress (too little or too much of a resource), not seen in actively growing cells • Increased TEP production is correlated with the maintenance and senescence phases of phytoplankton growth • In previous ocean acidification studies: • Bulk TEP has been correlated to chlorophyll-a, bacterial production, dissolved organic matter, and particulate organic matter • These correlations appear to be dependent on the presence of a phytoplankton bloom. • A possible mechanism to increase export of carbon from surface waters to depth
(Wurl et al. 2011) Phytoplankton exude polysaccharides
(Wurl et al. 2011) Phytoplankton exude polysaccharides TEP is formed through aggregation
(Wurl et al. 2011) Phytoplankton exude polysaccharides TEP is formed through aggregation marine snow Aggregates are removed from system via export
Factors affecting TEP production and cycling • Abiotic • Temperature • Turbulence • pH • Nutrients • Sedimentation • Biotic • Phytoplankton and bacterial production • Bacterial remineralization • Viral lysis • Grazing by zoo- and microzooplankton
Factors affecting TEP production and cycling • Abiotic • Temperature • Turbulence • pH • Nutrients • Sedimentation • Biotic • Phytoplankton and bacterial production • Bacterial remineralization • Viral lysis • Grazing by zoo- and microzooplankton
Factors affecting TEP production and cycling • Abiotic • Temperature • Turbulence • pH • Nutrients • Sedimentation • Biotic • Phytoplankton and bacterial production • Bacterial remineralization • Viral lysis • Grazing by zoo- and microzooplankton
Factors affecting TEP production and cycling • Abiotic • Temperature • Turbulence • pH • Nutrients • Sedimentation • Biotic • Phytoplankton and bacterial production • Bacterial remineralization • Viral lysis • Grazing by zoo- and microzooplankton
Factors affecting TEP production and cycling • Abiotic • Temperature • Turbulence • pH • Nutrients • Sedimentation • Biotic • Phytoplankton and bacterial production • Bacterial remineralization • Viral lysis • Grazing by zoo- and microzooplankton
Factors affecting TEP production and cycling • Abiotic • Temperature • Turbulence • pH • Nutrients • Sedimentation • Biotic • Phytoplankton and bacterial production • Bacterial remineralization • Viral lysis • Grazing by zoo- and microzooplankton
Experimental Objectives • Determine how chosen factors affect TEP production within the mesocosm experiment • To examine correlations between bulk TEP production and phytoplankton, bacteria, and microzooplankton. • To determine any significant difference in TEP production between in situ water conditions and FHL and the acidified ocean of the future.
Materials and Methods • Nine mesocosms, three treatments • Duplicate samples taken with an integrated sampler • Samples filtered within two hours of collection* * Except made for fossil hunting
Materials and Methods • Analyzing TEP • Filters are stained with Alcian Blue, soaked in 80% sulfuric acid, then analyzed using the colorimetric method. • Absorbance is related to weights using a calibration curve
TEP Mesocosm Time Series Why are the high and control different from the drift but not each other?
What makes the drift different? • How are the biotic factors, such as phytoplankton and bacteria, responding to the treatments? • How do the abiotic factor differ between treatments? • Which of these abiotic factors effect the physiological response of these organisms?
Biotic Factor: Phytoplankton • Both Chlorophyll a and TEP show the control ending above the high, and increase over time. • For both the drift treatment is significantly lower than the high treatment. • Suggest phytoplankton are the main producers of TEP in the system. P < 0.001
Biotic Factor: Bacteria • The control and high treatments are significantly higher than the drift treatment for both Bacterial Abundance and TEP. P < 0.03
But why is the drift significantly lower? • All treatments experienced the same temperature and turbulence conditions • Initial nutrients were highly similar in all treatments • The only factor which changed between treatments was the pCO2 • Drift was allowed to change whereas High and Control concentrations were maintained
But why is the drift significantly lower? Photosynthesis: 106CO2 + 16NO3 + PO4 ORGANIC MATTER + 138O2
But why is the drift significantly lower? HIGH OR CONTROL
But why is the drift significantly lower? Photosynthesis: 106CO2 + 16NO3 + PO4 ORGANIC MATTER + 138O2
But why is the drift significantly lower? Photosynthesis: 106CO2 + 16NO3 + PO4 ORGANIC MATTER + 138O2
Conclusions • TEP production is affected by repetitive enrichment of waters with CO2 • The ways different factors influence TEP concentrations are complex. Further studies should be completed to ensure a better understand of how TEP functions under ocean acidification conditions.
Acknowledgements • OA apprentices, technicians, and advisors! • Jim Murray, Evelyn Lessard, Mike Foy, Amanda Fay, Barbara Paul, Kelsey, Amy, Natsuko, Jennifer, Kiely, Phil, Kelly, Andrew. • Friday Harbor Labs • Project Funding: • Educational Foundation of America and the National Science Fund for funding the project • Alice M. Barger and Andrea Reister for funding my education the past two years • Mary Gates Research Endowment Fund • Steve Emerson and Kathy Krogsland for use of their lab equipment at the UW • My family, partner, friends, and current roommate, Collin, for all of the great support
TEP Mesocosm Time Series Why did TEP peak and then drop in all treatments? Figure 1. Transparent exopolymer particle time series based on median values. Error bars are the median standard deviation Green data represent control mesocosms, red high mesocosms, blue drift mesocosms, and black the dock. Statistically significant differences were found between the drift and high treatment (0.848, p=0.001) and the drift and control treatment (0.879, p=0.000).
What caused the sudden decreased in TEP? • Unlikely due to sampling error, present in all bags • Both Temperature and pCO2 decrease in days prior to TEP decrease • Source says temperature affects TEP production?
Biotic Factor: Phytoplankton • TEP production often associated with maintenance and senescence phase of phytoplankton • Population of Thalassiosira has growth rates constant and close to zero, suggesting this is a source of TEP
Experimental Results Were there any significant differences in TEP production between current water conditions and the predicted future conditions? What biotic factors was TEP correlated to within our mesocosm? Why was the drift significantly different from the high and the control, but the high and control were not different from each other? Why were initial TEP concentrations about zero? There was no significant difference between TEP production in the control treatment and the high treatment, but the drift treatment was different from the control and high. TEP is significantly correlated to Chlorophyll a, Biogenic Silica, and Bacteria Abundance. higher production is most likely associated with the repeatative enrichment of CO2 to the control and high treatments but not the drift Turbulence during filling of the mesocosms
TEP Mesocosm Time Series Why doesn’t TEP start at zero?
Why were initial concentrations of TEP above zero? • Previous mesocosm studies show increased turbulence results in increased TEP formation in water • Highly turbulent conditions persistent during mesocosm filling
Biotic Factor: Phytoplankton p < 0.01
Biotic Factor: Bacteria • Two possible reasons for this correlation: • Bacteria are producing TEP • Currently no method for discerning from a bulk value whether TEP is phytoplankton or bacteria derived • Bacteria are remineralizing TEP • Further information necessary